Download
1 / 13
130 likes | 308 Vues
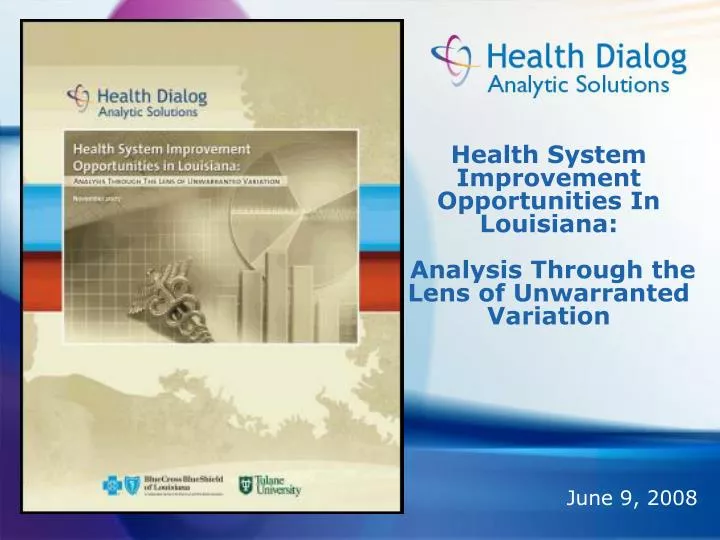
Health System Improvement Opportunities In Louisiana: Analysis Through the Lens of Unwarranted Variation. June 9, 2008. Unwarranted Variation. Geographic variation that cannot be explained by illness or need, the dictates of evidence based medicine, or patient preferences*.

E N D
Health System Improvement Opportunities In Louisiana: Analysis Through the Lens of Unwarranted Variation June 9, 2008
Unwarranted Variation Geographic variation that cannot be explained by illness or need, the dictates of evidence based medicine, or patient preferences* Effective Care – includes services of proven clinical effectiveness derived from randomized controlled trials (traditionally defined measures of quality) Preference-Sensitive Care – conditions for which treatment options exist that carry significant tradeoffs in terms of risks and benefits for the patient Supply-Sensitive Care – care where the amount given is strongly correlated with health system resource capacity (efficiency) *Dartmouth Atlas of Health Care: http://www.dartmouthatlas.org/agenda.shtm
Project Impetus and Purpose • Louisiana Health Care Redesign Collaborative - strategy for New Orleans and State • The Blue Cross Blue Shield of Louisiana (BCBSLA) Foundation & Tulane – utilize data to inform decisions • Health Dialog – build a multi-payer data warehouse using pre-storm data for benchmarking and analysis
Distribution of FloodingOrleans Neighborhoods (post-storm) • Population decrease of almost 50% • Primary Care Physician decrease of 50% • Hospital inpatient capacity decrease of 80% Health care issues in Louisiana did not start with Hurricanes Katrina or Rita
Data Warehouse:2.3 Million State Residents, 2005 (pre-storm) • 2005 total State population: 4.5 million* • Data represents complete Medicare & Medicaid eligibility files • 977,000 Medicaid beneficiaries • 584,000 Medicare beneficiaries • 100,000 Dual-eligibles • Private/BCBSLA data fully-insured book of business • 591,000 members Data Warehouse Payer Mix *U.S. Census Bureau (www.census.gov/popest/states/tables/NST-EST2005-01.xls)
8 – Northeast 7 – Northwest 6 – Central 9 – Northshore 2- Baton Rouge 5– Southwest 4- Acadiana 1- New Orleans 3- Houma Geographic Units of Analysis LA Department of Health and Hospital’s health care regions HospitalService Areas* *Dartmouth Atlas defined empirically derived local health care markets (67 in LA)
Utilization Variation by Region: Population with Chronic Disease – Admits/1,000 • Average: 750 Admits/1,000 *Age & sex adjusted
Does chronic disease influence utilization variation? Variation in Healthcare Utilization for Chronic Disease* & Non-chronic Populations - Children • Diamonds represent Louisiana Hospital Services Areas (HSAs) with ≥ 10,000 people Natchitoches Bogalusa *Chronics: CHF, COPD, Diabetes, Asthma, CAD
Does insurance type influence utilization variation? Variation in Healthcare Utilization by Payer: Admission Rates for Children – Medicaid vs. Private • Diamonds represent Louisiana Hospital Services Areas (HSAs) with ≥ 45,000 people Alexandria New Orleans
1.72x 2.11x Does race influence cost variation? Medicare Variation: Impact of Race on Cost • Diamonds represent Louisiana Hospital Services Areas (HSAs) with ≥ 45,000 people • Only Medicare claims data identifies race
R² =0.24 Is there a correlation between cost and quality? Quality & Cost – Beta Blocker Adherence & Annual Expenditures for CAD Patients • Average Beta blocker use 56% • Average cost $27,000
Variation in Preference Sensitive Care Preference Sensitive Care: Back Surgery Rates/1,000 • The Statewide average is approximately 3/1,000 • A 6-fold difference exists between the highest and lowest HSAs • Diamonds represent Louisiana Hospital Services Areas (HSAs) with ≥ 10,000 people
Summary of Findings • Prior to Hurricane Katrina, significant geographic variation in utilization, cost, and quality existed within Louisiana • Not due to conditions, payer, race, or gender • Higher costs are not correlated with higher quality • Significant variation in Preference Sensitive Care exists throughout the State • Local health care system factors play a significant role in Unwarranted Variation • Supply • Idiosyncratic decisions by providers • Louisiana Health Care Quality Forum adopting project as part of mission to help improve quality in the State • Report available at LHCQF.ORG