Download
1 / 35
360 likes | 505 Vues
T-Tests and Chi2. Does your sample data reflect the population from which it is drawn from?. Single Group Z and T-Tests.

E N D
T-Tests and Chi2 Does your sample data reflect the population from which it is drawn from?
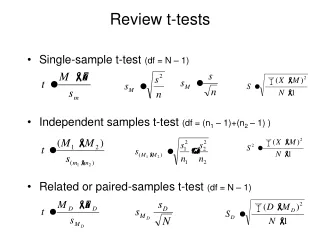
Single Group Z and T-Tests • The basic goal of these simple tests is to show that the distribution of the given data under examination are not produced by chance and that there is some systematic pattern therein. • Main point is to show the mean of a sample is reflective of the population. • Salkind’s text skips a discussion of single group/sample T-Tests.
Review of Z-Tests • Recall that a Z-score can measure the location of a given value on a normal distribution, which can be expressed as a probability. • A Z-Test uses the normal distribution to obtain a test statistic based on some data that can be compared with a sampling distribution of chance, which is an abstract construction drawn from the data. • This is a parameter estimation, which is an inference of a sample based on a population of data.
Problem with Z Tests • But because we do not often know the population variance, σ2, we estimate a single “point estimate” or value (sample mean). • However, this sample mean may vary greatly from the real population mean, μ. This error is called “sampling error.”
Problem with Z Tests • A confidence interval is set up to estimate μ. This is a range of values that is likely to include the value of the population mean (at the center of the interval). The larger the sample, the more the sample mean should equal the population mean, but there may be some error within the confidence interval. How far is the from μ ?
Student’s T-Test • Problem: We may not know the mean and variance of some populations, which means we cannot do a Z-Test. In this case, we use a T-test, Student’s T to be specific, for use with a single group or sample of data. • Again, this is when we are not looking at different groups but a sample of data as an entirety. We will next examine differences in groups.
Student’s T-Test • One uses this test when the population variance is unknown, as is usually the case in the social sciences. • The standard error of the sampling distribution of the sample mean is estimated. • A t distribution (not normal curve, more platykurtic but mean=0) is used to create confidence intervals, like critical values.
T Distribution • Very similar to the Z distribution by assuming normality. • Normality is obtained after about 100 data observations. • Basic rule of parameter estimation: the higher the obs (N) of sample the more reflective of overall population.
The t formula For α =.05 and N=30 , t =2.045
95% CI using t-test • Mean= 20 • Sy = 5 • N= 20 20± 2.086 (5/19) = 20.55 upper 19.45 lower
T-Tests Independent Samples
T-Tests of Independence • Used to test whether there is a significant difference between the means of two samples. • We are testing for independence, meaning the two samples are related or not. • This is a one-time test, not over time with multiple observations.
T-Test of Independence • Useful in experiments where people are assigned to two groups, when there should be no differences, and then introduce Independent variables (treatment) to see if groups have real differences, which would be attributable to introduced X variable. This implies the samples are from different populations (with different μ). • This is the Completely Randomized Two-Group Design.
For example, we can take a random set of independent voters who have not made up their minds about who to vote for in the 2004 election. But we have another suspicion: H1: watching campaign commercials increases consumption of Twinkies (snackie cakes), or μ1≠ μ2 Null is μ1= μ2 After one group watches the commercials, but not the other, we measure Twinkie in-take. We find that indeed the group exposed to political commercials indeed ate more Twinkies. We thus conclude that political advertising leads to obesity.
Two Sample Difference of Means T-Test Pooled variance of the two groups Sp2 = = common standard deviation of two groups
Two Sample Difference of Means T-Test • The nominator of the equation captures difference in means, while the denominator captures the variation within and between each group. • Important point: of interest is the difference between the sample means, not sample and population means. However, rejecting the null means that the two groups under analysis have different population means.
An example • Test on GRE verbal test scores by gender: Females: mean = 50.9, variance = 47.553, n=6 Males: mean=41.5, variance= 49.544, n=10
Steps of Testing and Significance • Statement of null hypothesis: if there is not one then how can you be wrong? • Set Alpha Level of Risk: .10, .05, .01 • Selection of appropriate test statistic: T-test, chi2, regression, etc. • Computation of statistical value: get obtained value. • Compare obtained value to critical value: done for you for most methods in most statistical packages.
Steps of Testing and Significance • Comparison of the obtained and critical values. • If obtained value is more extreme than critical value, you may reject the null hypothesis. In other words, you have significant results. • If point seven above is not true, obtained is lower than critical, then null is not rejected.
The critical values are set by moving toward the tails of the distribution. The higher the significance threshold, the more space under the tail. Also, hypothesis testing can entail a one or two-tailed test, depending on if a hypothesis is directional (increase/decrease) in nature.
Steps of Testing and Significance • The curve represents all of the possible outcomes for a given hypothesis. • In this manner we move from talking about a distribution of data to a distribution of potential values for a sample of data.
GRE Verbal Example Obtained Value: 2.605 Critical Value? Degrees of Freedom: number of cases left after subtracting 1 for each sample. Is the null hypothesis supported? Answer: Indeed, women have higher verbal skills and this is statistically significant. This means that the mean scores of each gender as a population are different.
Let’s try another sample • D:\POLS 5300 FA04\Comparing Means examples.xls • Type in the data in SPSS
Paired T-Tests • We use Paired T-Tests, test of dependence, to examine a single sample subjects/units under two conditions, such as pretest - posttest experiment. • For example, we can examine whether a group of students improves if they retake the GRE exam. The T-test examines if there is any significant difference between the two studies. If so, then possibly something like studying more made a difference.
ΣD = sum differences between groups, plus it is squared. n = number of paired groups
Paired T-Tests • Unlike a test for independence, this test requires that the two groups/samples being evaluated are dependent upon each other. • For example, we can use a paired t-test to examine two sets of scores across time as long as they come from the same students. • If you are doing more than two groups, use ANOVA.
Let’s Go to SPSS • Using the data from last time, we will now analyze the Pre-test/Post-test data for GRE exams. • D:\POLS 5300 FA04\Comparing Means examples.xls
Nonparametric Test of Chi2 • Used when too many assumptions are violated in T-Tests: • Sample size to small to reflect population • Data are not continuous and thus appropriate for parametric tests based on normal distributions. • Chi2 is another way of showing that some pattern in data is not created randomly by chance. • Chi2 can be one or two dimensional.
Nonparametric Test of Chi2 • Again, the basic question is what you are observing in some given data created by chance or through some systematic process?
Nonparametric Test of Chi2 • The null hypothesis we are testing here is that the proportion of occurrences in each category are equal to each other. Our research hypothesis is that they are not equal. Given the sample size, how many cases could we expect in each category (n/#categories)? The obtained/critical value estimation will provide a coefficient and a Pr. that the results are random.
Cross-Tabs and Chi2 • One often encounters chi2 with cross-tabulations, which are usually used descriptively but can be used to test hypotheses.