Download
1 / 27
280 likes | 523 Vues
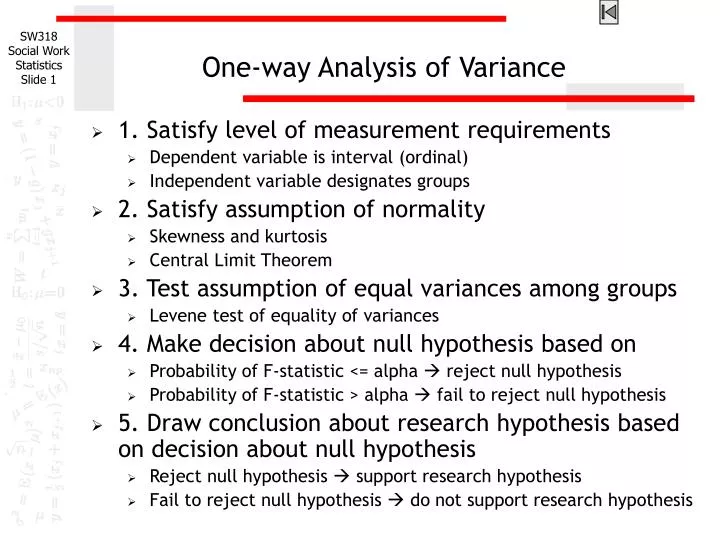
One-way Analysis of Variance. 1. Satisfy level of measurement requirements Dependent variable is interval (ordinal) Independent variable designates groups 2. Satisfy assumption of normality Skewness and kurtosis Central Limit Theorem 3. Test assumption of equal variances among groups

E N D
One-way Analysis of Variance • 1. Satisfy level of measurement requirements • Dependent variable is interval (ordinal) • Independent variable designates groups • 2. Satisfy assumption of normality • Skewness and kurtosis • Central Limit Theorem • 3. Test assumption of equal variances among groups • Levene test of equality of variances • 4. Make decision about null hypothesis based on • Probability of F-statistic <= alpha reject null hypothesis • Probability of F-statistic > alpha fail to reject null hypothesis • 5. Draw conclusion about research hypothesis based on decision about null hypothesis • Reject null hypothesis support research hypothesis • Fail to reject null hypothesis do not support research hypothesis
ANOVA Practice Problem – 1 This question asks you to use ANOVA to answer whether there is a relationship between [lcouncu] and [marstat], or whether the average [marstat] differs among groups defined by [lcouncu]. A one-way analysis of variance requires that the independent variable specify groups or categories and the dependent variable be interval level. The independent variable [lcouncu] is nominal level, satisfying the requirement for the independent variable. The dependent variable [marstat] is nominal level which does not satisfy the requirement. The answer is incorrect application of a statistic.
ANOVA Practice Problem – 2 This question asks you to use ANOVA to answer whether there is a relationship between country [lcouncu] and age [age], or whether the average [age] differs among groups defined by [lcouncu]. Since the independent variable [lcouncu] is nominal and the dependent variable [age] is interval, it satisfies level of measurement requirement for using ANOVA.
ANOVA in SPSS (1) Next step is to examine the distribution of the dependent variable. You can check whether the dependent variable is normally distributed or not in: Analyze > Descriptive Statistics > Descriptives…
ANOVA in SPSS (2) After moving [age] into “Variable(s):” box, click “Options…” button to select the distribution statistics.
ANOVA in SPSS (3) Select “Kurtosis” and “Skewness” to examine whether [age] is normally distributed or not. Then, click “Continue” and “OK” buttons.
ANOVA in SPSS (4) [Age] satisfied the criteria for a normal distribution. The skewness of the distribution (.590) was between -1.0 and +1.0 and the kurtosis of the distribution (-.150) was between -1.0 and +1.0. If we did not satisfy normality with skewness and kurtosis, we can try to satisfy normality with a variation of the Central Limit Theorem which requires that each group have 10 or more cases.
ANOVA in SPSS (5) You can conduct One-Way ANOVA by clicking: Analyze > Compare Means > One-Way ANOVA…
ANOVA in SPSS (6) Dependent variable [age] goes to “Dependent List:” box and the independent variable [lcouncu] goes to “Factor:” box. Then, click “Options…” button to select statistics options.
ANOVA in SPSS (7) Select “Descriptive” and “Homogeneity of variance test” in the “Statistics” section of “One-Way ANOVA: Options” window. Then, click “Continue” and “OK” buttons.
ANOVA in SPSS (8) First of all, you have to check the equal variance assumption. The probability associated with Levene's Test for Equality of Variances (p<0.001) is less than or equal to the level of significance (0.01). We reject the null hypothesis that the variances are equal and conclude that the assumption of equal variances is not satisfied. However, since analysis of variance is robust to violations of this assumption, we will add a caution to any true findings rather than conclude that this is an incorrect application of a statistic.
ANOVA in SPSS (9) The probability of the F test statistic (F=32.638) was p<0.001, less than or equal to the alpha level of significance of 0.01. The null hypothesis that the mean "age" [age] is the same for all groups defined by the variable "current country of residence" [lcouncu] is rejected. The research hypothesis that the mean "age" [age] for groups defined by the variable "current country of residence" [lcouncu] is not the same for all groups is supported by this analysis. The answer to the problem is true with caution. The caution is added because of the violation of the assumption of equal variances.
ANOVA Practice Problem – 3 This question asks you to use ANOVA to answer whether there is a relationship between country [lcouncu] and number of children in the household [nkidinhh], or whether the average [nkidinhh] differs among groups defined by [lcouncu]. Since the independent variable [lcouncu] is nominal and the dependent variable [nkidinhh] is interval, it satisfies level of measurement requirement for using ANOVA.
ANOVA in SPSS (10) Next step is to examine the distribution of the dependent variable. You can check whether the dependent variable is normally distributed or not in: Analyze > Descriptive Statistics > Descriptives…
ANOVA in SPSS (11) After moving [nkidinhh] into “Variable(s):” box, click “Options…” button to select the distribution statistics.
ANOVA in SPSS (12) Select “Kurtosis” and “Skewness” to examine whether [age] is normally distributed or not. Then, click “Continue” and “OK” buttons.
ANOVA in SPSS (13) [nkidinhh] did not satisfy the criteria for a normal distribution. The skewness of the distribution (1.945) was larger than +1.0 and the kurtosis of the distribution (4.015) was larger than +1.0 also. In this case, you have to look at the sample size for each group to see whether you can apply the central limit theorem. Sample size for every sub-group of independent variable should be equal to or larger than 10 to apply the central limit theorem.
ANOVA in SPSS (14) You can conduct ANOVA by clicking: Analyze > Compare Means > One-Way ANOVA…
ANOVA in SPSS (15) Dependent variable [nkidinhh] goes to “Dependent List:” box and the independent variable [lcouncu] goes to “Factor:” box. Then, click “Options…” button to select statistics options.
ANOVA in SPSS (16) Select “Descriptive” and “Homogeneity of variance test” in the “Statistics” section of “One-Way ANOVA: Options” window. Then, click “Continue” and “OK” buttons.
ANOVA in SPSS (17) The assumption of normality was satisfied by the Central Limit Theorem, since all groups had 10 or more cases.
ANOVA in SPSS (18) First of all, you have to check the equal variance assumption. The probability associated with Levene's Test for Equality of Variances (p=0.001) is less than or equal to the level of significance (0.01). The assumption of equal variances is not satisfied. However, since analysis of variance is robust to violations of this assumption, we will add a caution to any true findings rather than conclude that this is an incorrect application of a statistic.
ANOVA in SPSS (19) The probability of the F test statistic (F=3.149) was p=0.043, less than or equal to the alpha level of significance of 0.05. The null hypothesis that the mean "number of kids under 16 in the household" [nkidinhh] is the same for all groups defined by the variable "current country of residence" [lcouncu] is rejected. The research hypothesis that the mean "number of kids under 16 in the household" [nkidinhh] for groups defined by the variable "current country of residence" [lcouncu] is not the same for all groups is supported by this analysis. The answer to the problem is true with caution. The caution is added because of the violation of the assumption of equal variances.
Steps in solving One-Way ANOVA problemsLevel of Measurement The following is a guide to the decision process for answering homework problems about one-way ANOVA problems: Is the dependent variable ordinal or interval level and independent variable nominal? Incorrect application of a statistic No Yes Compute the skewness, and kurtosis for the variable to test assumption of normality.
Steps in solving One-Way ANOVA problems Assumption of Normality Assumption of normality satisfied? (skew, kurtosis between -1.0 and + 1.0) Yes No Sample size 10+ in each group to apply Central Limit Theorem? No Incorrect application of a statistic Yes Compute the one-way ANOVA
Steps in solving One-Way ANOVA problemsAssumption of Equal Variances Is the p-value for the Levene’s test for equality of variances <= alpha? No Yes Add a caution to any true findings rather than conclude that this is an incorrect application of a statistic.
Steps in solving One-Way ANOVA problemsDecision about Hypotheses Is the p-value for the F ratio test <= alpha? No False Yes Is the variable ordinal level? No True Yes True with caution