Download
1 / 14
150 likes | 331 Vues
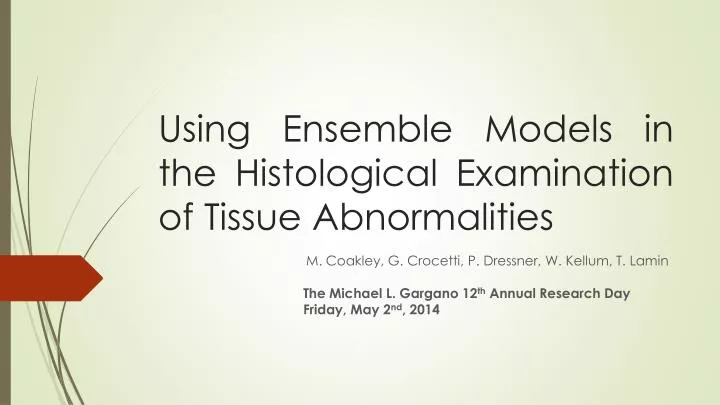
Using Ensemble Models in the Histological Examination of Tissue Abnormalities. M. Coakley, G. Crocetti, P. Dressner, W. Kellum, T. Lamin. The Michael L. Gargano 12 th Annual Research Day Friday, May 2 nd , 2014. Objective. The objective of this study is:

E N D
Using Ensemble Models in the Histological Examination of Tissue Abnormalities M. Coakley, G. Crocetti, P. Dressner, W. Kellum, T. Lamin The Michael L. Gargano 12th Annual Research DayFriday, May 2nd, 2014
Objective The objective of this study is: • to investigate the possibility of automatically identifying abnormalities in tissue samples through the use of an ensemble model on data generated by histological examination • to minimize the number of false negative cases.
Introduction • As part of breast cancer prevention screening if a lump is found a fine-needle aspiration biopsy (FNAB) is performed. • Normally the sample is analyzed visually by a pathologist that looks for cancerous tissues with abnormal characteristics. • This procedure is time consuming • Automatic procedures do exists that evaluate cytology features derived from a digital scan of breast FNAB slides. • These procedure achieve very high accuracies, and better than manual procedure, but still have a certain level of false negative • Our goal is to reduce the false negative rate
The Data • Wisconsin Breast Cancer Dataset • Containing 569 samples classified as “normal” or “abnormal” • 12 attributes • Dataset split: • Training set: 448 samples. • Test set: 121 samples.
The Data Cont.… • Table Structure (12 fields) IdDiagnosis (A=Abnormal/ N=Normal)Radius (mean of distances from center to points on the perimeter)Texture (standard deviation of gray-scale values)PerimeterAreaSmoothness (local variation in radius lengths)Compactness (perimeter^2 / area - 1.0)Concavity (severity of concave portions of the contour)Concave points (number of concave portions of the contour)SymmetryFractal dimension ("coastline approximation" - 1)
Exploratory Data Analysis • The data set was of very good quality • No missing values • Outliers detected through the use of Z-Score, with a possible outlier falling outside of the interval [-4,+4] • We detected some outliers, but further investigation excluded errors in the data.
Exploratory Data Analysis (Cont.…) • Normality Assumption: variables normally distributed within acceptable variations • Skewness within [-2,+2] • Kurtosis within [-2,+2]
Exploratory Data Analysis (Cont.…) • Normalization: to avoid that variables will influence the model due to their scales we normalized the data using the min-Max transformation • All resulting variables were within the interval of [0,1]
Exploratory Data Analysis (Cont.…) • Normalization: to avoid that variables will influence the model due to their scales we normalized the data using the min-Max transformation • All resulting variables were within the interval of [0,1] • Correlation • We kept radius and dropped the other variables.
Clustering • Derived a new “cluster” variable by applying the K-Means algorithm with k=2.
Modeling • Due to the characteristics of the data we applied two algorithms • CART (with misclassification costs) • Logistic Regression • Confusion Matrixes & Error Rates
Ensemble Model • We leveraged the confidence interval measures produced by these models. • Applied a voting scheme in which the prediction with the highest confidence wins.
Conclusions • The voting-based ensemble model derived through the combination of decision trees and logistic regression proved to be a very efficient way of helping in improving the detection of abnormal biopsy samples. • The very low false negative rate of 1% is a clear indication that this problem can be solved by the generation of high quality classification solutions, representing an improvement when compared to other classification systems developed in the past.
References • E. D. Pisano, L. L. Fajardo, D. J. Caudry, N. Sneige, W. J. Frable, W. A. Berg, I. Tocino, S. J. Schnitt, J. L. Connolly, C. A. Gatsonis, and B. J. McNeil, Fine-Needle Aspiration Biopsy of Nonpalpable Breast Lesions in a Multicenter Clinical Trial, Radiology, 2001, Vol. 219, Issue 3, pp. 785-792 • W. H. Wolberg, W. N. Street, O. L. Mangasarian, Breast Cytology Diagnosis Via Digital Image Analysis, Dept. of Surgery, Universit of Wisconsin, 1993 • W. Wolberg, W.N. Street, O.L. Mangasarian, Importance of nuclear morphology in breast cancer prognosis, Clinical Cancer Research, (1999) Vol. 5, 3542-3548 • B. Lantz, “Machine Learning with R”, Packt Publishing, 2013 • UCI-Machine Learning Repository, http://archive.ics.uci.edu/ml/ • D. Larose, Discovering Knowledge in Data, Wiley, 2005. • G. Seni and J. F. Elder, Ensemble Methods in Data Mining, Morgan & Claypool Publishers, 2009. • J. F. Elder and S. S. Lee, Bundling Heterogeneous Classifiers with Advisor Perceptrons, University of Idaho, Technical Report, Oct. 1997.