Download
1 / 1
10 likes | 187 Vues
4. A. dilutions vs OD450-NPPA. dilutions vs OD450-PP1A. dilutions vs OD450-PP2A. 3. 2. OD450nm. 1. 0. 2. 4. 8. 16. 32. 64. 128. 256. 512. 1024. 2048. Dilution factor (number x 1000). B. Competitors. NPP. PP1. PP2. Primary antibody. Coating antigens. NPP. 152. 302.

E N D
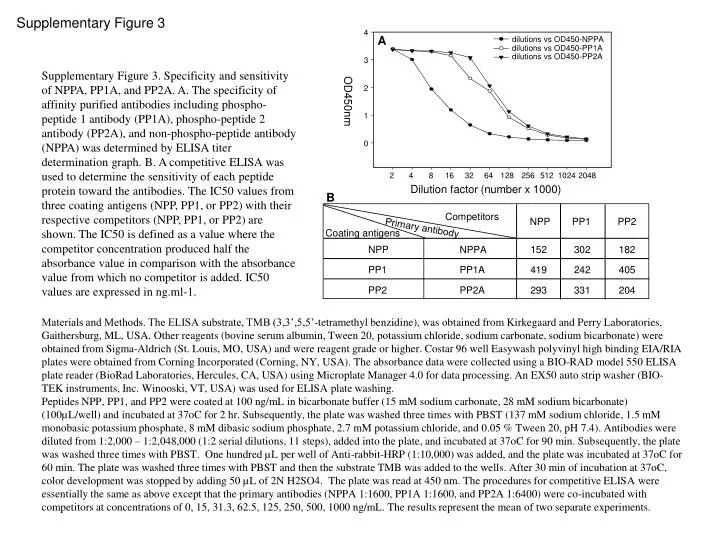
4 A dilutions vs OD450-NPPA dilutions vs OD450-PP1A dilutions vs OD450-PP2A 3 2 OD450nm 1 0 2 4 8 16 32 64 128 256 512 1024 2048 Dilution factor (number x 1000) B Competitors NPP PP1 PP2 Primary antibody Coating antigens NPP 152 302 182 NPPA PP1 PP1A 419 242 405 PP2 PP2A 293 331 204 Supplementary Figure 3 Supplementary Figure 3. Specificity and sensitivity of NPPA, PP1A, and PP2A. A. The specificity of affinity purified antibodies including phospho-peptide 1 antibody (PP1A), phospho-peptide 2 antibody (PP2A), and non-phospho-peptide antibody (NPPA) was determined by ELISA titer determination graph. B. A competitive ELISA was used to determine the sensitivity of each peptide protein toward the antibodies. The IC50 values from three coating antigens (NPP, PP1, or PP2) with their respective competitors (NPP, PP1, or PP2) are shown. The IC50 is defined as a value where the competitor concentration produced half the absorbance value in comparison with the absorbance value from which no competitor is added. IC50 values are expressed in ng.ml-1. Materials and Methods. The ELISA substrate, TMB (3,3’,5,5’-tetramethyl benzidine), was obtained from Kirkegaard and Perry Laboratories, Gaithersburg, ML, USA. Other reagents (bovine serum albumin, Tween 20, potassium chloride, sodium carbonate, sodium bicarbonate) were obtained from Sigma-Aldrich (St. Louis, MO, USA) and were reagent grade or higher. Costar 96 well Easywash polyvinyl high binding EIA/RIA plates were obtained from Corning Incorporated (Corning, NY, USA). The absorbance data were collected using a BIO-RAD model 550 ELISA plate reader (BioRad Laboratories, Hercules, CA, USA) using Microplate Manager 4.0 for data processing. An EX50 auto strip washer (BIO-TEK instruments, Inc. Winooski, VT, USA) was used for ELISA plate washing. Peptides NPP, PP1, and PP2 were coated at 100 ng/mL in bicarbonate buffer (15 mM sodium carbonate, 28 mM sodium bicarbonate) (100µL/well) and incubated at 37oC for 2 hr. Subsequently, the plate was washed three times with PBST (137 mM sodium chloride, 1.5 mM monobasic potassium phosphate, 8 mM dibasic sodium phosphate, 2.7 mM potassium chloride, and 0.05 % Tween 20, pH 7.4). Antibodies were diluted from 1:2,000 – 1:2,048,000 (1:2 serial dilutions, 11 steps), added into the plate, and incubated at 37oC for 90 min. Subsequently, the plate was washed three times with PBST. One hundred µL per well of Anti-rabbit-HRP (1:10,000) was added, and the plate was incubated at 37oC for 60 min. The plate was washed three times with PBST and then the substrate TMB was added to the wells. After 30 min of incubation at 37oC, color development was stopped by adding 50 µL of 2N H2SO4. The plate was read at 450 nm. The procedures for competitive ELISA were essentially the same as above except that the primary antibodies (NPPA 1:1600, PP1A 1:1600, and PP2A 1:6400) were co-incubated with competitors at concentrations of 0, 15, 31.3, 62.5, 125, 250, 500, 1000 ng/mL. The results represent the mean of two separate experiments.