Download
1 / 1
10 likes | 109 Vues
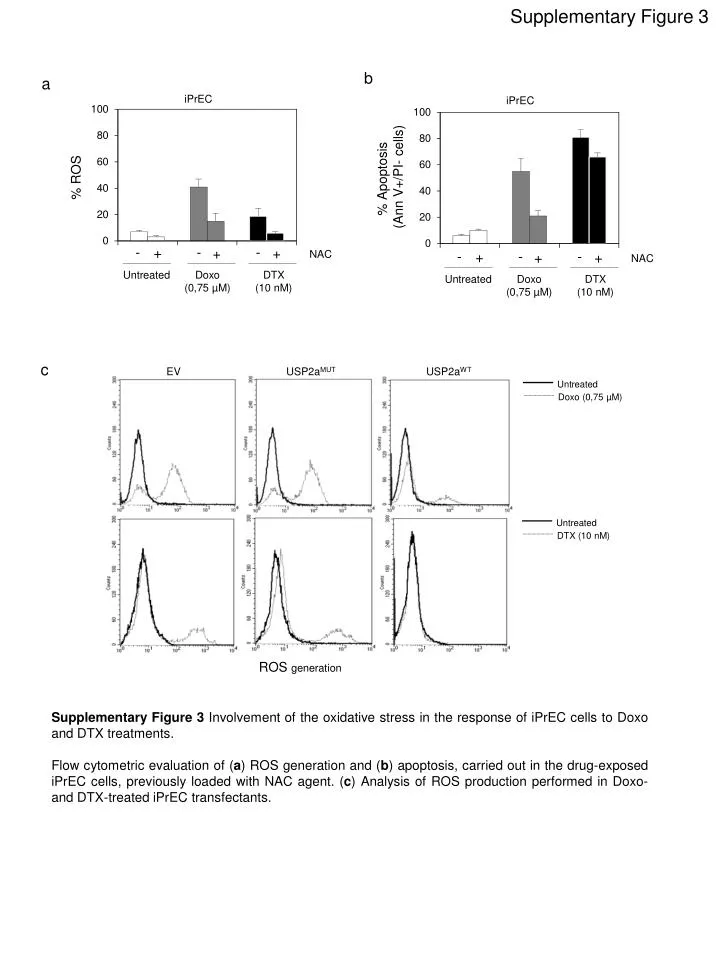
Supplementary Figure 3. a. iPrEC. Untreated. Untreated. Doxo (0,75 µM). DTX (10 nM). % ROS. % Apoptosis (Ann V+/PI- cells). b. iPrEC. -. -. -. -. -. -. +. +. +. +. +. +. c. NAC. NAC. EV. USP2a MUT. USP2a WT. Untreated. Untreated. Doxo (0,75 µM). Doxo

E N D
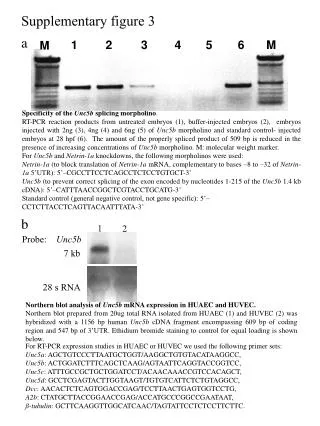
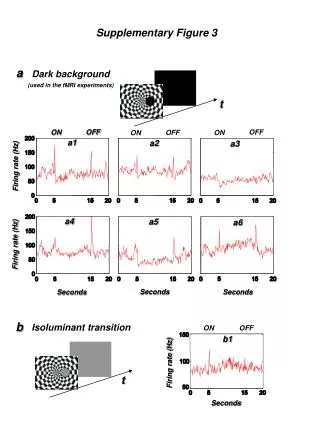
Supplementary Figure 3 a iPrEC Untreated Untreated Doxo (0,75 µM) DTX (10 nM) % ROS % Apoptosis (Ann V+/PI- cells) b iPrEC - - - - - - + + + + + + c NAC NAC EV USP2aMUT USP2aWT Untreated Untreated Doxo (0,75 µM) Doxo (0,75 µM) DTX (10 nM) DTX (10 nM) ROS generation Supplementary Figure 3 Involvement of the oxidative stress in the response of iPrEC cells to Doxo and DTX treatments. Flow cytometric evaluation of (a) ROS generation and (b) apoptosis, carried out in the drug-exposed iPrEC cells, previously loaded with NAC agent. (c) Analysis of ROS production performed in Doxo- and DTX-treated iPrEC transfectants.