Download
1 / 12
120 likes | 127 Vues
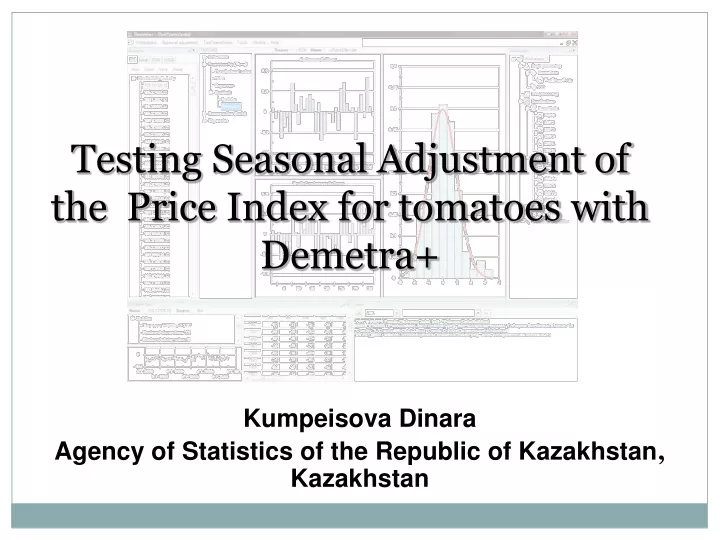
Testing Seasonal Adjustment of the Price Index for tomatoes with Demetra+. Kumpeisova Dinara Agency of Statistics of the Republic of Kazakhstan , Kazakhstan. The approach T RAMO/SEATS was used ; - Specification RSA5 was used ; - The calendar of national holidays was used. Pre-treatment.

E N D
Testing Seasonal Adjustment of the Price Index for tomatoes with Demetra+ Kumpeisova Dinara Agency of Statistics of the Republic of Kazakhstan, Kazakhstan
The approach TRAMO/SEATS was used; - SpecificationRSA5 was used;- The calendar of national holidays was used.
Pre-treatment Estimation time span: 2002 - 2009 year; Pre-determined calendar effects according specification RSA5 were used Used model type ARIMA (0,1,1)(0,1,1)s Deviating values not found: number of outliers: Good (0,000) Апрель 2011
Graph of results Seasonal component is lost in the noise of the irregular component, that indicating minor seasonal fluctuations of the series. If seasonal fluctuations amplitude does not have a strongly pronounced tendency to variations with the time, in this case the additive model can be selected, otherwise the multiplicative model is preferable. In our case – it is an additive model.
The spectrum of residuals The graph shows that there are no indications of residual seasonal and calendar effects, in time series adjusted for seasonal fluctuations, because the seasonal frequency and the frequency of trading days does not show any spectral peaks.
Check for a sliding seasonal factor In the graph unstable and changing seasonal factors are not observed.
Evolutive seasonality test Submitted data showthat sliding seasonal component is on the 20% significance level in the time series of index of industrial production. Seasonal fluctuations are identified in the initial time series, but there is no residual seasonality in the whole series in the last 3 years time series adjusted on seasonal fluctuations.
Stability of model The closer a point of update to the red line, the more stable the model. According to the results of this series, we have two points that go slightly beyond the deviating values.
Residual distribution Residuals are random, normal and independent.
Present some problematic series (if you had some) All results from diagnostic panel“Diagnostics”are Good Except spectral seasonal peaksare (Bad (0,04). To what is it necessary to pay attention to and how to fix it?
Conclusions Methodological recommendations are needed on the results interpretation with Demetra + More detailed analysis of the residuals is needed
Thank you for your attention! Questions? E-mail: D.Kumpeisova@stat.kz