Download
1 / 15
150 likes | 260 Vues
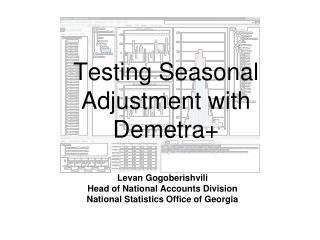
Testing seasonal adjustment of the Index of industrial production for 2000-2010, using Demetra+. Ermurachi Galina National Bureau of Statistics , Republic of Moldova. Check the original time series. Properties of the original time series. Spectral analysis of the original series.

E N D
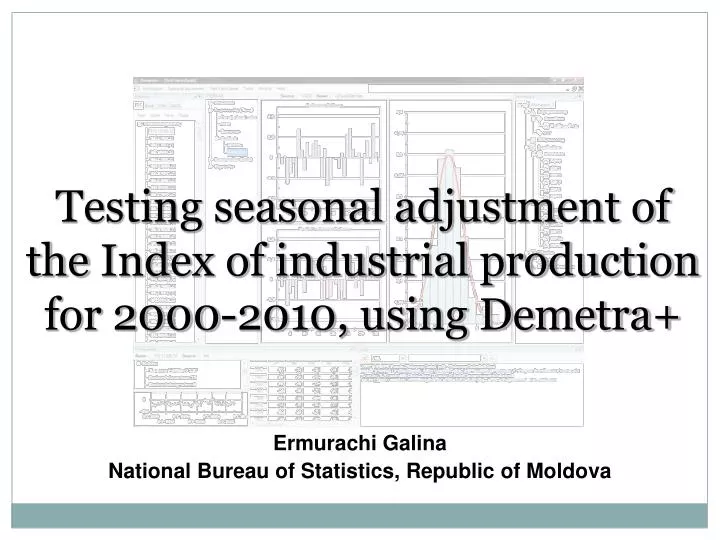
Testing seasonal adjustment of the Index of industrial production for 2000-2010, using Demetra+ Ermurachi Galina National Bureau of Statistics, Republic of Moldova
Check the original time series • Properties of the original time series
Spectral analysis of the original series Graphs showing the presence of seasonality and the effect of operating days.
Seasonal adjustment The approach TRAMO/SEATS was used Calendar of national holidays was created and used We started the analysis with the specification RSA4, with change of some options
Used models pre-treatment : The estimated period :[1-2000 : 12-2010] Pre-processing (Tramo) Estimation span: [1-2000 : 12-2010] Series has been log-transformed Trading days effects (2 variables) Easter effect detected No outliers found Decomposition trend. Innovation variance = 0,0845 seasonal. Innovation variance = 0,0188 irregular. Innovation variance = 0,3407 Dispersion of seasonal and trending components are lower than fluctuations of components, specifications of which deviate from normal. This means that the obtained stable trending and seasonal components. It can be concluded that the adopted assumption of a canonical decomposition. Adjustment was applied taking into account national holidays and Easter Used model type ARIMA (0,1,1)(0,1,1)
Graph of results Seasonal component is lost in the noise of non-standard component. This means that the number of seasonal variations may be negligible.
Sliding seasonal factors We noticed unstable and moving seasonal factors.
Main quality indicators Main results of quality diagnostics
Test for presence of seasonality The data presented show that there is a moving seasonal component to the 20% level of significance, in the series of industrial production index. Seasonal variations are identified in the original series, but the entire series, nor the last 3 years the series adjusted for seasonal variations, have no residual seasonal fluctuations. The presence of moving seasonally not surprising, given the above described plot ratio of C-H.
Spectral diagnostics According to the graphics, we can assume that there is no residual seasonal and calendar effects, the residual of the series adjusted for seasonal variations, since the seasonal frequency, and frequency of trading days found no spectral peaks.
Stability of the model The nearer the point of updates to the red line, the more stable the adjustment. According to the results of this series we have two points that go beyond the deviating values.
Residuals Residuals are distributed as random normal and independent
Problematic series (if there were any) All the results obtained in the panel "Diagnostics" shows that they are good (Good), but spectral seasonal peaks are obtained that are uncertain (Uncertain (0,42). Are these results considered good or not and if not, then what you need to do to fix it?
Questions More attention should be paid to the results obtained and how to interpret them correctly Detailed analysis of the residuals
Спасибо за внимание! E-mail: galina.ermurache@statistica.md