Download
1 / 41
510 likes | 769 Vues
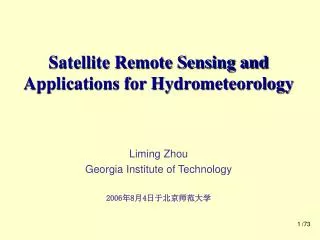
Multi and Hyperspectral Remote Sensing for Marine and Coastal Applications. Ecology, Climate, Physical Oceanography. Turquoise = phytoplankton bloom. Bering Sea, Alaska SeaWifs Image (Norman Kuring image, NASA, April 25, 1998). Some marine applications. Chlorophyll concentrations

E N D
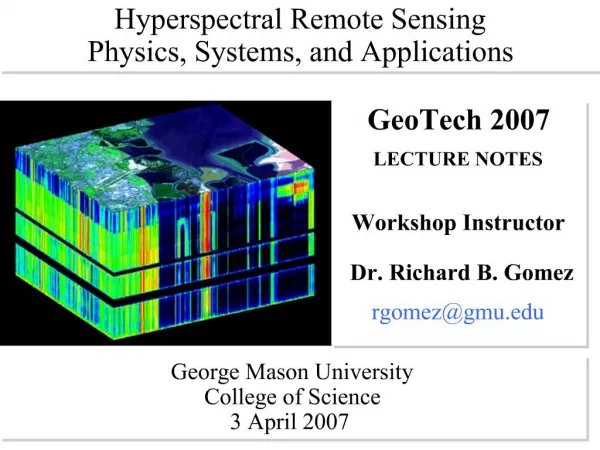
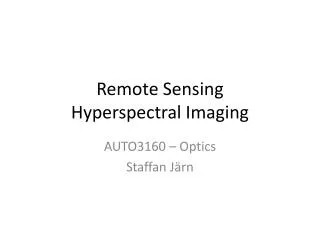
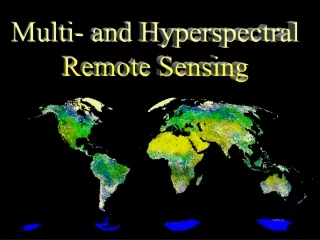
Multi and Hyperspectral Remote Sensing for Marine and Coastal Applications Ecology, Climate, Physical Oceanography
Turquoise = phytoplankton bloom Bering Sea, Alaska SeaWifs Image (Norman Kuring image, NASA, April 25, 1998)
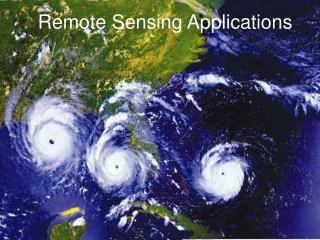
Some marine applications • Chlorophyll concentrations • Productivity • Carbon cycling • Water clarity and suspended sediment • Ocean color • Fisheries management • Currents • Search and Rescue • Deep sea drilling, etc.
Ocean chlorophyll concentrations • Chlorophyll is used by plants to trap light energy which then drives photosynthesis • Amount of chlorophyll related to amt. of photosynthesis • Ocean productivity • Carbon cycling • Ocean ecology – food webs/fisheries • Can estimate amount of chlorophyll in oceans using spectral data and models
Spectral properties of ocean phytoplankton • Phytoplankton spectral reflectance similar to that of land plants in the visible part of the spectrum • Chlorophyll reflects more green visible than blue or red • Can also measure amount of fluorescence with some sensors (e.g., MODIS) • IR light almost all absorbed by water and not a strong part of the ocean phytoplankton signature
Visible Wavelengths NIR Wavelengths
2004 “Red Tide” off coast of Florida with SeaWiFS chlorophyll and MODIS flourescensce
Ocean productivity • Measured by the net amount of carbon “fixed” by biota in the oceans • Can’t be directly measured—must be modeled using remotely sensed data as inputs • Function of amount of chlorophyll, ocean temperature, amount of incoming solar radiation, and mixing models to deal with 3-dimensional ocean (it has depth) • Oceans are net sinks for carbon – remove carbon from the atmosphere at rate of 40-50 Gigatons/year. • Global GPP is about 123 Gigatons/year. • Extremely important to understand this so that we can understand what happens to the carbon we are putting in the atmosphere
Ocean plants need sunlight as do land plants – productivity drops off with depth. So does our ability to remotely sense chlorophyll.
Water clarity and suspended sediment • Open ocean water nearly sediment free – perfectly clear • Near-shore water holds variable sediment loads and is more turbid • Turbid water coincides with more productive parts of ocean near shore due to input of sediment by rivers and shallower water • Turbidity can cause erroneous chlorophyll (and productivity) measurements from RS • Important to know where ocean is turbid so that you can be careful about predicting chlorophyll there.
Spectral properties of turbid water • Turbid waters are more reflective than clear water • Peaks in spectral response depend on: • Amount of sediment • Depth profile of sediment • Type of sediment (mineralogy, etc.) • Turbidity can be a temporal phenomenon – sediment input by rivers after floods, stirred up by hurricanes and other wind events, etc.
Change in spectral curves with time in turbid water during settling: 575 nm spectral peak declines with reduced turbidity
Fisheries • Ocean fisheries are most productive where ocean productivity is high • High chlorophyll content relates to high productivity • But…too much productivity or harmful blooms (e.g., red tides) can harm fisheries • Ocean currents, climate change, nutrient inputs from land, etc. affect fisheries • Pollution can harm fisheries especially near shore • All of these things can be monitored with remote sensing and other geospatial tools
Global Fisheries Theglobaleducationproject.org
Satellites for Marine Remote Sensing • SeaWiFS (Sea-viewing Wide Field of view Sensor) • Flies on the OrbView-2 platform • Designed to monitor ocean color • MODIS • Flown on the Aqua and Terra platforms • Photosynthetic activity of marine organisms • Related to carbon cycle in oceans • Some MODIS bands designed for ocean RS
SeaWiFS specifications Bands: Visible and NIR 1 km pixels Daily return
Coastal applications of optical RS • Coastal erosion monitoring • Hurricane damage assessment • Estuarine ecology • Coastal geomorphology • Coastal ecology • Human impacts
Coastal Monitoring Goals… “The coastal component [of remote sensing] is designed to detect, assess, and predict the effects of weather, climate, natural hazards, and human activities on the state of the coastal ocean, its ecosystems and living resources, and the U.S. economy. It consists of both a national backbone and regional coastal ocean observing systems…”
Case Study: Chesapeake Bay • Chesapeake Bay is the largest estuary in the U.S. • Important fishery (fish, crabs, oysters, etc.) • Hammered by pollution from major East Coast river and urban inputs • E.g., Susquehanna River, Potomac River, Washington/Baltimore, etc. • Nutrient inputs, pesticides, industrial chemicals, etc. • Very populated coastal zone with vulnerability to erosion, sea level rise, hurricanes, etc. • Many issues common to coastal zones globally
Remote sensing in Chesapeake Bay • Airborne and satellite imagery used to: • Monitor chlorophyll concentrations • Monitor sediment loads • Model ecosystems • Model pollution • Manage fishery • Track coastal erosion • Contribute to near shore land use planning
Hurricane Isabel 2003 Extensive damage to human structures, coastal erosion and temporary changes in water quality
Ganges Delta, Bangladesh. Coastal zones are often densely populated and vulnerable. Will be a focus of remote sensing for years to come.
Acknowledgements • Most Chesapeake Bay slides/figures from presentations at a Smithsonian Environmental Research Center (SERC) symposium.