Download
1 / 36
370 likes | 683 Vues
Scale. Representing Scale on Maps. Definition: The scale of a map is the ratio between distances on the map and the corresponding distances in the real world. 10 miles. Map Scale. Scale representation on the map:

E N D
Representing Scale on Maps • Definition: • The scale of a map is the ratio between distances on the map and the corresponding distances in the real world.
10 miles Map Scale • Scale representation on the map: • Representative fraction (RF): “1:100,000”, “1 to 100,000”, or “1/100,000” • Verbal: 1 inch is equal to 50 miles • Graphic: Scale bar
Map scale is a ratio • It is unit-independent • 1/1000 > 1/100,000 • (1/100 is greater than 1/100,000) • Thus 1:1000 is a large scale map, showing a smaller region but magnified • 1/100,000 is a small scale map, showing a larger region
Point of confusion • Scale in most other contexts, even in geography, is not used as a ratio • e.g., data, area, processes, government, & economies • For example: Large scale data (e.g., global temperature distribution), affects large scale processes (e.g., ocean circulation patterns), but this data is shown on small scale maps • Often we circumvent confusion by using terms like “regional scale” or “hill slope scale”, but confusion can still occur if we ask “which is larger?” • Take home message: if/when I ask about “map scale” on an exam I mean the ratio (i.e., small scale = large area), otherwise scale means what you think it should
General Classification of Map Scale • Notions of small and large are reversed from our conventional thinking when we talk about map scale large scale refers to looking at a small area in detail • Here are some scale guidelines: • Large scale map 1:400 to 1:50,000 • Intermediate scale map 1:50,000 to 1:250,000 • Small scale map 1:250,000 and beyond
Map Scale and Map Projections • The representative fraction of a map does not tell us the scale everywhere on the map • Transformations due to projecting maps introduce distortion • The representative fraction (and the scale bar) is only accurate along standard lines or points
Scaling Up • Data created for local areas can be used for larger (regional or national) areas • Note: now we are talking about scale in common terms (not map scale), so “up” implies larger areas
Maps and GIS - Scaling Up • The river network shown here on a national scale was produced at a much finer scale, and it contains a great deal of detail that cannot be seen at this map scale
Maps and GIS - Scaling Up This level of detail is not necessary or useful at the national scale. All the detail that is encoded in this river network data is really only visible and useful when operating at more local scales. Vector datasuch as this river may need to be smoothed for scaling up.
Maps and GIS - Scaling Up White pine White pine wheat wheat Lodgepole pine Lodgepole pine rice rice Scale Effect on Mapping Scaling up (aggregating) What should we call these cells? Raster datamay need to be generalized. An aggregation algorithm must be chosen.
Maps and GIS - Scaling Down • Small scale data contains more detail than large scale data • Using large scale data for analysis at a smaller scale can cause problems
Maps and GIS - Scaling Down Here we can see a national scale coastline (shown in red) superimposed over local scale data, we can clearly see thegeneralizationandlack of detail
Vertical Scale • As with horizontal scales, vertical scale is related to the level of detail of the information conveyed by the map • Contour lines are often used to define the vertical scale • Contour intervals are usually provided as “X feet” or “X meters” meaning a contour line will be placed on the map marking the X vertical change • For example: “Contour interval 80 feet” • Contour lines are also frequently used in meteorology (e.g., temperature and air pressure)
Vertical Scale: Contour Lines What is the contour interval for this example?
Scale Question 1 • Which map has a larger map scale and which map covers a larger geographic area? • 1:1,000,000 or 1:12,000
Scale Question 2 • On a map with a scale of 1:100,000 how much distance is represented by 2 cm?
Scale Question 3 • USGS topographic maps (commonly called quadrangles) have a scale of 1:24000 • Using such a map to plan a hike, you determine that the trail is 11 3/8 inches long • How far will you be hiking?
Scale Question 4 • Given the representative fraction 1:1,000,000, what is the verbal scale (i.e., the word statement that conveys scale) in cm-to-km?
Scale Question 5 • Given the representative fraction 1:62,500, what is the verbal scale (i.e., the word statement that conveys scale) in inches-to-miles?
Scale Question 6 • How many pixels (a.k.a. raster or GRID cells) from a Landsat image are required to cover a square mile? • Landsat pixels have 30-meter spatial resolution • 1 mile ~ 1.61 km
Scale Questions 7 - 9 Approximately how much elevation did we gain on this hike? Approximately how far did we hike in straight-line distance? Approximately how far did we hike in actual distance?
Scale Questions 7 - 9 • Approximately how much elevation did we gain on this hike? • Approximately how far did we hike in straight-line distance? • Approximately how far did we hike in actual distance? • Panoramic photo taken at sunrise from ~1000 ft below the below the summit
Choosing a scale • The scale of your data should be chosen according to: • Your data needs • The intended use of the existing data
Examples • Your data options are: • Landsat TM data (30 meter resolution) • SPOT satellite imagery (5 meter resolution) • Ikonos satellite data (1 meter resolution) • What data source do you use when: • You’re building a nuclear power plant on a site near a lake, and need to plan the location of each component of the plant • Some illegal cutting of small patches of forest is going on in a national park in the Brazilian Amazon. We want to map where the cuts have occurred throughout the park.
Using scale in practice • Reading scale • Know how to determine distance using scale bars, representative fractions, and verbal statements of scale • Choosing a scale for display • Important for effectively conveying the information to map users, this is also related to the size of the map that will be produced (e.g., poster size vs. a figure in a paper) • Remember to include scale information on all maps that you create • Scale and accuracy • Data are accurate only for the scale at which they are collected and for larger areas (scaling up) • Extrapolating information to smaller areas can produce ecological fallacies
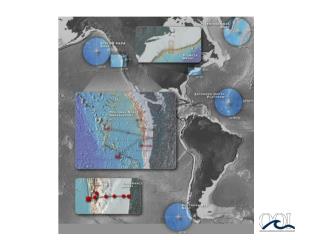
Scale & Accuracy Example • Here is an example of scale and accuracy from my own research • I study environmental controls on the alpine treeline ecotone (i.e., the transition zone between closed-canopy subalpine forests and the tundra, ice, snow, and rock that lies above) • In addition to controls like temperature and precipitation, I wanted to include species composition in my analysis because tree species respond differently to stress
Scale & Accuracy Example • The original paper maps were published in 4 books by E.L. Little in the 1970s, and did NOT include minimum mapping units (a.k.a. the scale for which they are accurate) • Here is what the metadata say • "At least 90% of the points tested on hard copy printout are within 1/50 inch (0.5mm) of the source data.” • "In some instances, data for the United States portions of the maps were derived from source maps at 1:10,000,000 scale and the portions outside the United States were derived from sources at approximately 1:27,000,000 scale. The coverages were checked for node, intersection, and duplication errors and corrected when necessary. All polygons were snapped closed at nodes." • My determination • There is no alternative dataset, so it’s this or nothing • 0.5 mm on a 1:10,000,000 scale map is equal to 5 km of error due to the digitization process • The accuracy of maps is almost certainly much worse (imagine drawing a range map on a map where 1mm = 10 km) • Therefore single species composition values should be taken at the study-site level because analysis, at larger scales is too problematic considering the limitations of this dataset