Download
1 / 47
470 likes | 480 Vues
Exploring Fitness and Free Energy Landscapes of Proteins Part 1: Statistical Models of Sequence Co-Variation. Fitness and drug resistance in HIV proteins Maximum entropy (Potts) models of residue co-variation Epistasis and entrenchment of mutations under drug selection pressure

E N D
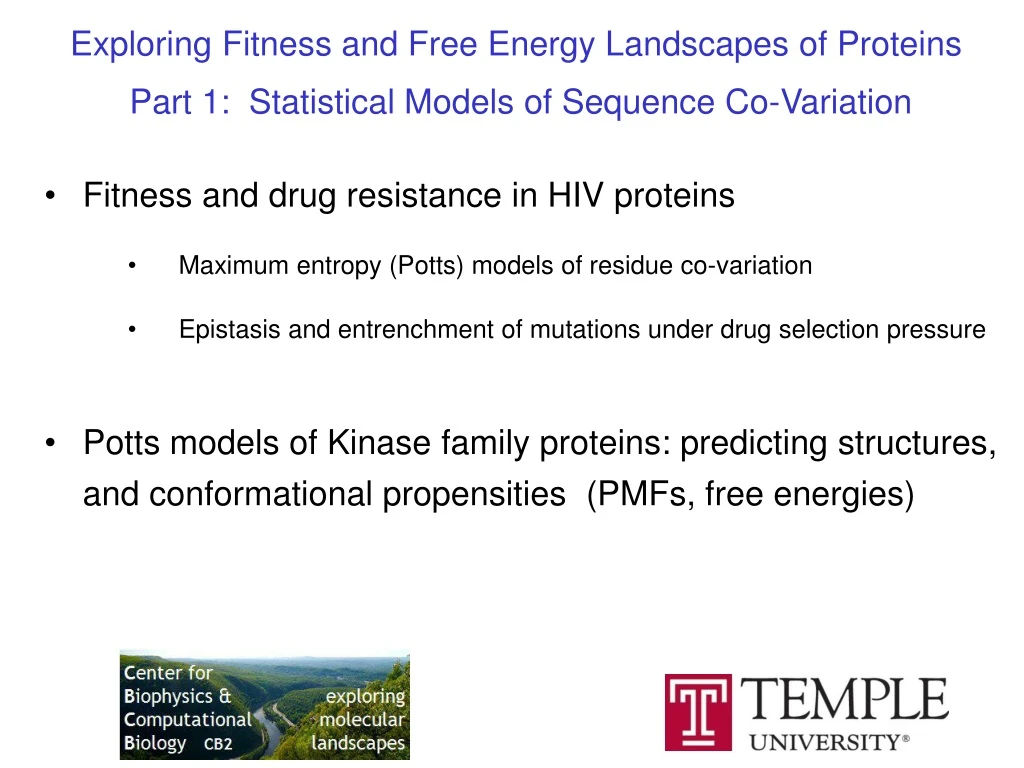
Exploring Fitness and Free Energy Landscapes of Proteins Part 1: Statistical Models of Sequence Co-Variation • Fitness and drug resistance in HIV proteins • Maximum entropy (Potts) models of residue co-variation • Epistasis and entrenchment of mutations under drug selection pressure • Potts models of Kinase family proteins: predicting structures, and conformational propensities (PMFs, free energies)
Portraits of Protein Free Energy Landscapes Conformational free energy landscapes Protein Folding Alanine dipeptide β C5 ψ φ ψ Energy αL αR Ala-dipept = 66 DoF ~1000 waters = ~9000 DoF Total = ~9066 DoF φ Entropy Protein Allostery Protein-Ligand Binding
Protein free energy landscapes in sequence space K7W9Z2|K7W9Z2_MAIZE J9ITR3|J9ITR3_9SPIT I1IJ61|I1IJ61_BRADI E9CEI4|E9CEI4_CAPO3 E9BYU8|E9BYU8_CAPO3 E3J4J9|E3J4J9_FRASU D3CUM1|D3CUM1_9ACTO F1L1J6|F1L1J6_ASCSU G7IU81|G7IU81_MEDTR A9VA07|A9VA07_MONBE D4TC93|D4TC93_9NOST K7W6C5|K7W6C5_9NOST D9VKL0|D9VKL0_9ACTO A9AZ92|A9AZ92_HERA2 G4YYG8|G4YYG8_PHYSP D0MVF2|D0MVF2_PHYIT H3GD48|H3GD48_PHYRM A0EEV5|A0EEV5_PARTE Q22HI9|Q22HI9_TETTS G7I651|G7I651_MEDTR F6H2A6|F6H2A6_VITVI B9EZ80|B9EZ80_ORYSJ A9AWW4|A9AWW4_HERA2 F2ULY5|F2ULY5_SALS5 D1AAT3|D1AAT3_THECD |G3HAL2|G3HAL2_CRIGR A G A A R G I V F A A R A A F A Chakraborty et al. 2013 Pos. 83 Pos. 67 Potts Statistical Energy Drug Naive Drug Experienced
Potts Models: Background • Newer use in Fitness Predictions • The Potts statistical energy E(S) is a proxy for fitness • Can score the effect of mutations in a sequence • Can explore collective effects of epistatic terms • Potts models of HIV drug Resistance – Levy Plos-CB, 2012 • HIV Immune response – Chakraborty PRE 2013 • History of use for Protein Contact Prediction • Direct Coupling Analysis (DCA) contact maps– Hwa PNAS 2009, Weigt, Onuchic PNAS 2009/2012/2013, Ekeberg PRE 2013 • Predicting Protein Stability – Wolynes PNAS 2014 Fitness Potts Statistical Energy Landscape (probability) Potts model of HIV Protease Potts model of Protein-Kinase Dataset: Dataset: L=175 L=99 Predictions of Conformational preference Predictions of fitness and entrenchment 8192 sequences 5610 sequences
Exploring Drug Resistance, Fitness and Epistasis in HIV-1 Protease:Potts models of residue co-variation from Multiple Sequence Alignments Free Energy Landscapes in Sequence Space Bill Flynn, Allan Haldane, and Ron Levy Temple University Center for Biophysics and Computational Biology Ongoing collaboration with Bruce Torbett Lab atScripps
HIV LIFE CYCLE 1 Binding HIV binds to the CD4 receptor and one of two co-receptors on the surface of a CD4+ T- lymphocyte. 2 Fusion HIV fuses with the host. 3 Uncoating Disintegration of the nucleocapsid and the release of virus's RNA 4 Reverse transcription Viral enzyme “reverse transcriptase” converts the ssRNA to a dsDNA. 5 Integration Viral enzyme “Integrase" fuses the HIV DNA within the host cell's own DNA. 6 Transcription provirus uses a host enzyme called RNA polymerase to make long chains of HIV protein. 7 Assembly HIV enzyme called “protease” cuts the long chains of HIV proteins into smaller individual proteins. 8 Budding Newly assembled virus pushes out ("buds") from the host cell. INTEGRASE
What is epistasis? The effect of a mutation at one position in the genome depends on the pattern of mutations at all other positions. Fitness effects of a mutation are context-dependent. Inference of epistatic effects leading to entrenchment and drug resistance in HIV Protease W. Flynn, A. Haldane, B. Torbett, and RML. Molecular Biology & Evolution, 2017 Correlated mutations provide a reservoir of stability in HIV-Protease O. Haq, M. Andrec, A. Morozov, and RML Plos CB, 2012
Motivation Builds off the work of Bruce Torbett * studying effects of double mutations. • Effects of single and double mutations are well-documented in the literature. • I84V-L90M occurs in roughly 10% of the treated sequences in the Stanford HIVDB. • If so detrimental, what mechanisms lead to their presence in many sequenced proteases? Modelling the collective effects of many mutations? • 75% of sequences in the HIVDB have more than 3 PI-associated mutations. • 50% have more than 5 PI-assoc mutations. We built a Potts statistical model to understand the role epistasis plays in large patterns of resistance mutations in HIV-1 protease. Melting Temperature Chang, Torbett. Accessory mutations maintain stability in drug-resistant HIV-1 protease. Journal of molecular biology (2011). 3+ mutations 6+ mutations * Chang & Torbett, JMB, 2012
Potts Models: Background The Potts model is a statistical model fit to an MSA, which captures the pairwise residue frequencies in the MSA. Couplings A G A A R G I V F A A R A A F A Fields Potts Statistical Energy Potts probability The Inverse Ising Problem • Goal: Infer Potts parameters h, J given an MSA. Computationally challenging. Techniques borrowed from statistical physics and computer science. • Our Strategy: Maximum likelihood using Quasi-Newton method with MCMC on GPUs (model) (observed) (likelihood of the MSA according to model) Maximized when model and data bivariates are equal Lövkvist et al, PRE 87, 2013
Inverse Ising Inference on GPUs • Implementation on GPUs: Monte Carlo evolution by point mutations • Procedure: • Evolve 4 million sequences in parallel on 4 GPUs, for 6.4 million MC steps each with current Potts Hamiltonian parameters. Calculate model bivariate marginals. (15 minutes) • Quasi-Newton step (parameter update) based on bivariate-marginal error • Repeat steps 1 and 2 until the error in the bivariate-marginals is minimized (~150 times) 1. Monte Carlo Sequence Generation on GPU Draw sequences 2. Quasi-Newton Step …LVTIKIGGQLR… …LVTIRIGGQLK… …VVTVKIGGQLK… …LVTVKIGGQLR… …VVTIKIGGQLK… Bivariate residuals Model MSA Coupling Update step 6.4x10⁶ steps 106 sequences (work units) Sequence Space Sample using trial J
Model validation and predictions for Protease Comparison of the correlated Potts model with an independent site model independent model Potts model Correlated Potts model MSA observed Independent model Correlated model accurately predicts probabilities to observe higher order sequence patterns in the Stanford HIVDB. Independent model is not predictive for larger patterns. Distribution of mutations in sequences generated by the Potts model reproduces the distribution found in the Stanford HIVDB.
HIV Story 1: Entrenchment One consequence of epistasis is “Entrenchment”: Mostly disfavorable interactions Primary mutation occurs G R A A A G I V F A A R A A F A Primary mutation Time New more favorable interactions Subsequent mutations tend to stabilize the initial mutation R A I A A G I V F V A R A A F A Accesory mutations New favorable interactions can come to dominate The mutation becomes “entrenched”, and harder to revert over time, so much that reversion may be disfavored G V I R A A A G I V F A R L F A (indirect effect)
Entrenchment • The Potts model is well suited to predict entrenchment effects Epistatic interaction terms Computing the cost of reversion: Primary mutation reverted to wild type Mutated sequence A I A A K G I V F V A R L G F A is used to quantify entrenchment, and can be used to classify sequences • Questions: • How many accesory mutations are needed in HIV protease to entrench mutations? • Are there particular patterns or motifs of mutations that cause entrenchment? • How strong is the entrenchment effect? A I A A R G I V F V A R L G F A
Entrenchment in the HIV dataset is apparent using the Potts model sequences with < 9 mutations resistance mutation L90M are less fit than wildtype L90 on average sequences with 9+ mutations resistance mutation L90M are more fit than wildtype L90 on average L90M reversionless probable backgroundpenalizesreversion backgroundfavorsreversion reversionmore probable
We published the entrenchment results as predictions, in Molecular Biology & Evolution, 2017
HIV Story 2: Confirming Entrenchment • Using the Potts model we can predict individual sequence fitnesses, but these predicted values can be hard to verify because of data limitations. • New idea after publication: We can verify the Potts predictions using aggregate statistics of many sequences ? A I A A G I V F V A R A A F A Given any particular “sequence background”, we can compute the Potts probability of residues in that background: Probability of amino acid at position in one background Predicted frequency of amino acid at position in a set of sequences S
Using the Potts model as a classifier Observed Dataset: Sequences with 7-14 mutations (2000 sequences) Potts model Prediction Most Destabilized (293 sequences) Most Entrenched (430 sequences) 97.3% M 3.2% M Predicted frequency of M Predicted frequency of M Entrenchment Score
Confirmation of Potts model entrenchmentpredictions The Potts model as a sequence classifier: Focus on sequences with 7-14 mutations, with high/low entrenchment. 97.1% of sequences observed to have M • The frequency-ratio M/L is ~1000 times higher in the most entrenched backgrounds than in the least entrenched. • The Potts model accurately predicts the frequency of L (wildtype) vs M (mutant) at position 90 in each group. • Very good agreement between predictions and observed entrenchment for many positions • It’s not just number of mutations – it’s also which mutations Most entrenched (430 sequences) Most destabilized (293 sequences) 3.6% of sequences observed to have M
PCA analysis reveals residue patterns which most stabilize the L90M primary mutation 46 84 20 73 10 90 each dot is a sequence L90M First principal component shows pattern of ~11 residues that strongly selects for the entrenchment of L90M. most stable least stable L10K20 D30M36M46G48…PIVTIKIGGQLIEALLDTGADDTVLEDMSLPGRWKPKIIGGIG L90M GFIKVRQYDQVPIEICGHKIISTVLVGPTPVNVIGRNLMTQL… I54G73 V82 I84 N88 PC1 that is most stabilizing for L90M L90M is ~1,000 times more likely in the background of than in background
Summary • The Potts model is a powerful tool from statistical physics that can be used to model networks of protein-protein interactions starting from protein multiple-sequence alignments. • These models accurately capture the epistatic interactions between drug-associated mutations and their effects on fitness. • We’ve demonstrated that primary mutations in HIV-1 are entrenched by specific sequence backgrounds, influencing HIV-1 drug resistance.
Exploring Fitness and Free Energy Landscapes of Proteins Part 1: Statistical Models of Sequence Co-Variation • Fitness and drug resistance in HIV proteins • Maximum entropy (Potts) models of residue co-variation • Epistasis and entrenchment of mutations under drug selection pressure • Potts models of Kinase family proteins: predicting structures, and conformational propensities (PMFs, free energies)
Structure of Kinase Catalytic Domain and Overview of Various Conformational States Three major conformations DFG - in (Active) DFG - out (Inactive) Src/CDK like conformation (Inactive) ~ 250 aa in length A small N lobe and a large C lobe “Hinge” connects the two lobes ATP binds in a cleft between the two lobes
Post 2008; Simonson 2010; Roux 2008, 2013, 2015; Gervasio 2012, 2015; Shaw 2013, 2015 ; Pande 2014 Proposal1. Binding energy Proposal2. protein reorganization Gleevec does not bind to Src-kinase DFG-out conformation Proposal2. Src kinase cannot achieve DFG-out conformation What controls Gleevec binding selectivity to DFGoutBinding energy or protein reorganization? DFG-in DFG-out Gleevec Phe Phe Asp Asp Abl kinase
Evolutionary Fitness Landscapes for Protein Allostery Evolutionary Sequence Correlations in Multiple Sequence Alignments imply Structural Interactions • Long history (25 yrs) for Protein Contact Prediction • Recent Advance: Maximum Entropy Potts models • Direct Coupling Analysis (DCA) contact maps– Hwa PNAS 2009, Weigt, Onuchic PNAS 2009/2012/2013, Ekeberg PRE 2013 • Predicting Protein Stability – Wolynes PNAS 2014 • Can we go further? • We want to use Potts models to predict: • Sequence-dependent conformational preference and the free energy landscapes (PMFs) of individual proteins • Combine Potts Modeling on sequence space and MD Free energy simulations in protein structure space Lövkvist et al, PRE 87, 2013
Connecting the landscapes – Motivated by the PMF of Ribose Binding Protein • Potts Model (2013) • of RBP Contacts from an MSA • Onuchicet al, PNAS 2013 • Coevolutionary analysis using a Potts Model confirms presence of “Twisted” conformation • Potential of Mean Force (2005) • for the Open to Closed transition of RBP • Levy et al, JMB 2005 • Molecular Dynamics Free Energy Simulations predicted an intermediate “Twisted” conformation along the PMF PDB (closed/open) Ribose Binding Protein PMF Open state PDB contacts open Predicted Twisted (metastable) twisted contacts not seen in PDB closed Closed state PDB contacts DCA twisted Contacts detected by DCA Closed State DCA Predictions Open State DCA Predictions
Potts Model inferred for Kinase Family reliably predicts structural contacts • Potts Model Interaction strengths PDB contact heat map (Computed from 3400 PDB crystal structures) (Inferred from Kinase MSA with 9,000 effective sequences) Haldane, Flynn, Peng, Vijayan, RML Protein Science 2016
Using the Potts model to understand DFG-In vs DFG-out Preference • The Potts model encodes information about the energetic couplings between residues which drives the DFG-in to DFG-out transition • Heat map of PDB “Contact Frequency Difference” brings out strong interactions between the DFG motif and the P-loop, aC-helix, HRD motif. Difference in contact Frequency in Crystal Structure (In vs Out) DFG-in Activation loop HRD Couplings between HRD and Activation loop are more favorable on average in DFG-in sequences: Sequence position DFG-out Sequence position More favorable Can look at couplings for particular position-pairs
Evolutionary Landscape (“PMF”) of the DFG-in to DFG-out Transition for two sequences Potts model can be used to understand the energetic landscape of each sequence • We can improve predictive ability by looking at many pairs at once. • Thread Sequences on conformations seen in PDB • Calculate a “Threaded Energy” using the Potts model couplings only at contact points DFG-in preferring sequence (EPHB4_HUMAN) DFG-out preferring sequence (MELK_HUMAN) ~1000 PDB structures Energy of Conformation Energy of Conformation DFG-out DFG-in DFG-out DFG-in Conformation Order Parameter DFG-in DFG-out Conformation Order Parameter DFG-in DFG-out
Predicting DFG-in to DFG-out Conformational Preference DFG-out preferring sequence DFG-in preferring sequence This sequence’s structure For each sequence, compute mean energy in each conformation Energy of Conformation Energy of Conformation DFG-out Difference in DFG-in and DFG-out energy gives conformational penalty DFG-out DFG-in DFG-in DFG-in DFG-in DFG-out Conformation DFG-out Conformation Each sequence’s predicted DFG-out penalty vs its observed structure PMF for each sequence Observed DFG-in Validation: Sequences with predicted penalty for DFG-out are never observed in DFG-out state Observed DFG-out Order Parameter Order Parameter
Conformational penalty predicts susceptibility to type II inhibitors in a high throughput assay • The Potts model “DFG-out penalty score” predicts whether type-II inhibitors bind to a set of 300 kinases in a High-Throughput binding assay (300 Kinases and 13 type-II inhibitors) • This strongly suggests that DFG-out penalty plays a role in inhibitor specificity Potts Model prediction of DFG-out Penalty matches observed hit rate Kinase-Inhibitor assay * gives for each kinase to type-II inhibitors Compounds Kinases * J. Peterson, R. Dunbrack, RML et al., J. Med. Chem., 58, 466 (2014)
Conclusions - Kinase Family Landscapes • Potts statistical energies can infer residue-residue interaction strengths and structural contacts from protein MSAs • Potts statistical energies can be used to probe the conformational landscape of individual sequences, providing insights into Kinase protein allostery and selectivity to type-II inhibitors (Gleevec) • Mapping the kinase active state and the many inactive states for individual sequences directly by constructing Potentials of Mean Force in multiple dimensions is a work in progress: (requires careful attention to collective variables, and definitions of stable states) Haldane, Flynn, Peng, and RML, Prot. Sci. (2016), COSB (2017), Biophys. J. (2017)
Acknowledgments DFT Solvation POTTS MODELS Nobuyuki Matubayashi Osaka University Allan Haldane Bin Zhang Bill Flynn (2017) Jackson Labs Di Cui AvikBiswas BEDAM Emilio Gallicchio CUNY, Brooklyn College Nan-jie Deng Pace University, NYC Omar Haq (2012) World Quant Hedge Fund
Acknowledgements The Levy Group • Ron Levy • Allan Haldane – Potts modeling projects • Avik Biswas – Potts modeling projects • Nanjie Deng – MD simulation analysis • Di Cui – MD simulation analysis • Junchao Xia – Grid based computing
Model inference – Markov Chain Monte Carlo Multiple Sequence Alignment From pair statistics, initialize model as This defines a sequence landscape by 10 11 12 13 14 15 16 17 18 19 20 21 22 23 24 25 L V T I K I G G Q L K E A L L D V V T I R V G G Q L K E A L I D I V T V K I G G Q L K E A L L D L V T V K V G G Q L R E A L I D V V T I K I E G Q L R E A L I D L V S I R I G G Q L K E A L L D L V T I K V G G Q L K E A L L D I V T I K I G G Q L R E A L L D Sample this landscape with many independent Monte Carlo walkers by mutating sequences via Metropolis criteria Draw 4,194,304 sequences …LVTIKIGGQLR… …LVTIRIGGQLK… …VVTVKIGGQLK… …LVTVKIGGQLR… …VVTIKIGGQLK… Compute difference in pair marginal estimates and update model parameters Sequence Space Iterate on GPUs 65536 walkers
Potts model of HIV-1 protease covariation Goal: Understand the networks of mutations that promote drug resistance in HIV-1 protease. Stanford University HIV Drug Resistance database (HIVDB) N=5,600 subtype B protease sequences Neff=4,600 patients Re-encode sequences in Q=4 letter alphabet Construct model Compute weighted marginals 6 hours40 quasi-Newton parameter update steps 65,536 MCMC walkers
Active and new inactive states of Abl and Lck kinases DFG-out loop unfolded active D DFGin Free energy A B A C inactive B DFG-out aloop partial folded active inactive C D αC- helix Phe Phe Asp αC- helix αC- helix Phe Arg Asp Asp Arg DFG-out aloop partial folded, Asp is salt bridged, can bind type II inhibitors. Lck kinase PDB:2OFV DFG intermediate, loop unfolded Asp is partially solvated and salt-bridged. Cannot bind type II inhibitors P38α kinase PDB:2NPQ DFG-out loop unfolded, Asp is buried, Unstable
“Shot Noise” has only a small effect on the quality of the Potts Inference Potts model Energy Independent model Energy • In-silico test: Fit a new Potts model to a finite sample of ~10000 sequences generated from the first Potts model • New Potts model recapitulates original sequence probabilities (fitness) to high accuracy • Independent model is unable to predict sequence probability (fitness) Haldane, Flynn, Peng, RML Biophys. J. 2017
Evolutionary Fitness Landscapes for Protein Allostery Evolutionary Sequence Correlations in Multiple Sequence Alignments imply Structural Interactions • Long history (25 yrs) for Protein Contact Prediction • Recent Advance: Maximum Entropy Potts models • Direct Coupling Analysis (DCA) contact maps– Hwa PNAS 2009, Weigt, Onuchic PNAS 2009/2012/2013, Ekeberg PRE 2013 • Predicting Protein Stability – Wolynes PNAS 2014 • Can we go further? • We want to use Potts models to predict: • Sequence-dependent conformational preference and the free energy landscapes (PMFs) of individual proteins • Combine Potts Modeling on sequence space and MD Free energy simulations in protein structure space Lövkvist et al, PRE 87, 2013
The Potts Model correctly predicts distribution of mutations in HIV Protease Potts model correctly predicts distribution of sequences which differ from the consensus by k mutations. Independent model is not predictive because the observed mutation patterns are correlated.
Why are primary resistance mutations more stable in some backgrounds and not others? Compare the most stable (top) sequences to the least stable (bottom) sequences with fixed hamming distance from consensus accessory mutations • More accessory mutations don’t necessarily increase stability • Specific, multi-residue patterns are responsible for increased stability (entrenchment)
Exploring Drug Resistance, Epistasis, and Fitness in HIV-1 Proteasewith Potts models Allan Haldane, AvikBiswas, and Ron Levy Temple University Center for Biophysics and Computational Biology Ongoing collaboration with Bruce Torbett Lab at Scripps
Potts Models predict sequence probabilities (fitness) up to the limit imposed by the finite sample size (“shot noise”) Hydrophobic spine • The discrepancy between Potts predictions and data is entirely accounted for by finite sampling effects in the data (blue vs dashed line). (Dashed line is an in silicoestimate of the expected correlation due uniquely to finite sampling) • Functional motifs, such as the hydrophobic spine, are both more correlated and more conserved.This leads to a very large difference in Potts vs Independent model correspondence with data. Potts model marginals Independent model marginals Avg. Correlation for different subsequence lengths Potts-predicted vs Observed subsequence probabilities for a functional set of 7 positions (hydrophobic spine) Haldane, Flynn, Peng, RML Biophysical Journal, 2017
Structure based free energy landscapes of kinases “All active kinases are alike, each inactive kinase is inactive in its own way.” Roland Dunbrack after Leo Tolstoy Src/cdk-like inactive state DFG-out loop folded Conformational selection and Free energy Different kinase conformational states DFG-in state DFG-out Loop Partial folded Other inactive new
Conformational penalty predicts susceptibility to type II inhibitors in a high throughput assay • The Potts model “DFG-out penalty score” predicts whether type-II inhibitors bind to a set of 300 kinases in a High-Throughput binding assay (300 Kinases and 13 type-II inhibitors) • This strongly suggests that DFG-out penalty plays a role in inhibitor specificity Potts Model prediction of DFG-out Penalty matches observed hit rate Kinase-Inhibitor assay * gives for each kinase to type-II inhibitors Compounds Kinases * J. Peterson, R. Dunbrack, RML et al., J. Med. Chem., 58, 466 (2014)
Entrenchment is a general phenomenon We observe both primary and accessory mutations exhibiting entrenchment. Reversion of an accessory mutation becomes very deleterious once primary mutations have accumulated in its presence. Entrenchment is a mechanism by which drug resistance mutations accumulate within the host population and drug resistance sequences become candidates for transmission. M46L I50V A71V G73S