Download
1 / 16
160 likes | 262 Vues
UPWELLING COMPARATIVE ATLAS PHYSICALS DATA FROM REMOTE SENSING D. DAGORNE IRD – Centre de Bretagne US025 : Interventions et à la Mer et Observatoires Océaniques. Context : UR097 / ECO-UP

E N D
UPWELLING COMPARATIVE ATLAS PHYSICALS DATA FROM REMOTE SENSING D. DAGORNE IRD – Centre de Bretagne US025 : Interventions et à la Mer et Observatoires Océaniques
Context : UR097 / ECO-UP • Comparative Atlas . Upwelling ecosystem functionning by comparison of statics and dynamics elements from « historical » existing data. • data worksheet and graphics • animated or fixed images from observations and modeling • synthetics indexes • - Operationnal « server » for data in near real time (NRT : few days or week ) providing caracteristics indexes of ecosystem state . • Beginning by products from remote sensing (satellites imagery) : • SST(s) - CHL - wind - ( altimetry) and derived indexes. • Fixed and animated plots and maps from climatologies, NRT data, anomalies and indexes to quantified present upwelling state and historical evolution. • Simulation results for forecast.
Others IRD requirements • Oceanic observatory from satellite for different research units • Atlantic Ocean ( African Monsoon experiment) : Guinea Gulf • Indian Ocean – Mozambique channel • Western Atlantic – Amazon/Carabiean • Oceanograhics cruises survey ( with data distribution « on board » ) • EGEE in Guinea Gulf ( may/jun and september/october 2005 - 2007) • Indian Ocean ( in january-february 2007) • Educationnal and training projects for developping countries. • data – « know how » (software) – RT acquisition & preprocessing
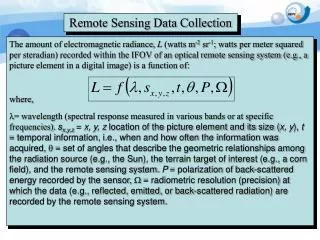
Data from Level 3 (bio-geophysical products) • by remote sensing « providers » • measurement quality • spatio-temporal resolution and granularity ( « composite » time) • beginning-ending period, .. • « real time » accessibility - new facilities : • Sea Surface Temperature (SST) • Sea Surface Reflectance (SSR or « Color ») • Wind : modulus / direction • Altimetry • Others : Water Vapour – radiative (SSI/DLI) and turbulent (LHF/SHF) fluxes • precipitations (poor resolution) – salinity ( 2008 ??)
SST from Infra-red ( clouds !! : detection – boundaries (in upw areas ) ) • Polar orbiting ( 2 pass ( day-night) by day ) • AVHRR/TIROS-N/NOAA 1985 – 2003 (2005) PathFinder V4 (9km) / V5 (4km) – MODIS/EOS/NASA ( ACQUA) : 07/2002 - present ( with SSR) • twice daily ( PFV5) / 3 days (MODIS) / weekly / monthly / clim • Geosynchronous • Eastern Atlantic : Meteosat (MSG) EUMETSAT - 07/2004 • Western Atlantic – South East Pacific : GOES -NOAA : 2002 • hourly – daily « composite » (3H -12H – 24H) - 10 / 5 km • - SST From Micro-Wave (*) (low resolution : 25 km – continental/island areas ) • TMI : 01/1998 ( 40 deg latitude limit) - AMSR/E : 07/2004 • daily / 3 days / weekly / monthly / clim • (*) and others products : IWV (integrated Water Vapour) – WSP (Wind Speed)
- Sea Surface Reflectance • from narrow band visible spectrum (day) observation - polar orbiter (1 / day ) • daily ( ?) / 3 days ( MODIS) / weekly / month / clim • - NLW : Normalized Leaving Water irradiance band • heavy constraints effects : Clouds - aerosols – WV - angles (sun, view) • - « standards » bio-optical products : CHLa - Absortion Coef (K490) - . • - «experimental» developpement : CDOM/SM – «regional» CHLa – FLH/PP • SeaWIFS 9km : 01/1998 – 12/2004 - / MODIS (with SST) 4 km : 07/2002 • CZCS ( pathwork areas :.. 1978-1984) • Wind retrievialfrom scaterrometer on polar orbiter ( 2 orb / day ) • ERS (ESA) 1992- 2002 ; 1deg - QuickScat (NASA) : 1999-present : 0.25 /0.5deg • « Mean » Wind Fields by « interpolation » 1 day /3 days / week / month • - Altimetry from Topex/Poseidon « merged » product ( CLS) – weekly • SLA : Sea Level Anomaly – ADT : Absolute Dynamic Topography
Working steps • Sate of « art » : providers , quality, data format, software,.. • acces / archiving all the usefull data • extraction software for various sources (format) • area-period data (3D cube : lat-lon-tim) in netCDF • analysis software : interactive wiewing , « QuickLook » production • multitemporal analysis (EOF,..), plot – time/space diagram • indexes ( with cartographic requierement : bathy) • WEB « navigation » • historical data : climatologies – monthly and anomalies • Automatic Daily Near Real Time on somes areas • ‘UPWelling Atlas » ( C. Mullon) • Next : historical and NRT indexes extraction • generic approach software tools for « users» requirements • data (format – area – period) – analysis
UPWELLING ATLAS Period : 1998/01 - 2004/12 ( SST PFV4 : 1995 - SLA : 1992) Climatologies – Monthly ( Anomalies ) - Weekly (octad) SST : TMI (remss) - AVHRR/PFV4-V5 (NASA/PO-DAAC) CHLA : SEAWIFS ( NASA/GSFC ocean color ) WIND : MWF QuickScat (IFREMER/CERSAT) SLA : merged T/P ( CLS ) NEAR REAL TIME daily Huge work !!.. Beginning 2005/10 .. In progress SST : TMI -3 D (1D) – MODIS-3D (1D) MSG/GOES hourly - 12H night composite (EUMETSAT-SAFO) CHLA : MODIS-3D WIND : QS-3D (1D - twice) (remsss - NRT facilities)
UPWELLING AREAS – global areas 40 deg lat – 25 deg lon extension
Near Real Time Day-1 / Day-2 « global » Upwelling areas Next slide Local areas
NEAR REAL TIME – MODIS SST-CHL DAILY PROCESSING From level 2 (1 km) swath data - 2006/11/25