Download
1 / 15
170 likes | 1.83k Vues
The coefficient of determination or R-squared. How do we know how accurate our equation is?The coefficient of determination or R-squared: Ratio of the explained sum of squares to the total sum of squares. R-squared = Explained Sum of Squares / Total Sum of SquaresR2 = ESS/TSS = R2 = 1 - RSS/TS

E N D
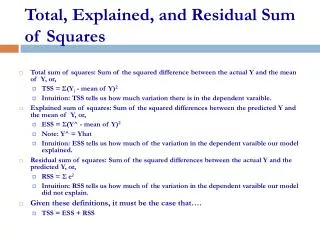
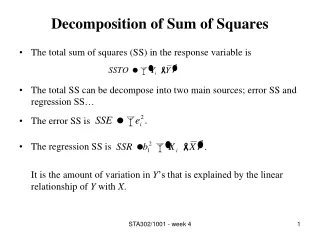
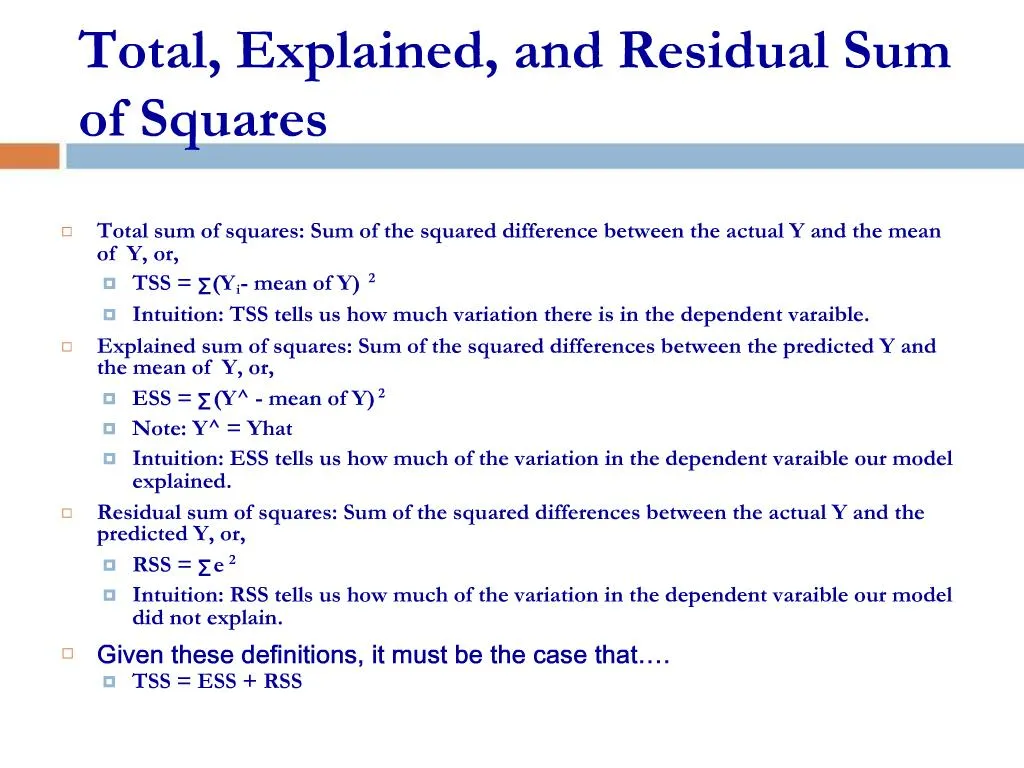
1. Total, Explained, and Residual Sum of Squares Total sum of squares: Sum of the squared difference between the actual Y and the mean of Y, or,
TSS = S(Yi - mean of Y)2
Intuition: TSS tells us how much variation there is in the dependent varaible.
Explained sum of squares: Sum of the squared differences between the predicted Y and the mean of Y, or,
ESS = S(Y^ - mean of Y)2
Note: Y^ = Yhat
Intuition: ESS tells us how much of the variation in the dependent varaible our model explained.
Residual sum of squares: Sum of the squared differences between the actual Y and the predicted Y, or,
RSS = S e2
Intuition: RSS tells us how much of the variation in the dependent varaible our model did not explain.
Given these definitions, it must be the case that�.
TSS = ESS + RSS
2. The coefficient of determination or R-squared How do we know how accurate our equation is?
The coefficient of determination or R-squared: Ratio of the explained sum of squares to the total sum of squares.
R-squared = Explained Sum of Squares / Total Sum of Squares
R2 = ESS/TSS =
R2 = 1 - RSS/TSS
R2 ranges from 0 to 1. A value of zero means our model did not explain any of the variation in the dependent variable. A value of 1 means the model explained everything. Neither 0 or 1 is a very good result.
3. The Simple Correlation Coefficient (r) r = (r2)0.5 = (ESS/TSS)0.5 = (1-RSS/TSS)0.5
Note: The above is only true when the number of independent variables is one.
Examples:
If r = 0.9, then r2 = 0.81
If r = 0.7, then r2 = 0.49
If r = 0.5, then r2 = 0.25
If r = 0.3, then r2 = 0.09
If X = Y then r = 1 Note: Also works vise versa
If X = -Y then r = -1
If X is not related to Y, then r = 0
4. Adjusted R-Squared Adding any independent variable will increase R2.
Why? Adding more variables will not change TSS. It can either leave RSS unchanged or lower RSS.
Unless the new variable has a coefficient of zero, RSS will fall.
To combat this problem, we often report the adjusted R2 (which Excel provides).
For those who are interested, here is the calculation:
Adjusted R2 = 1 - [RSS/(n-K-1)] / [TSS/(n-1)]
where n = observations
K = number of coefficients
ONE SHOULD NOT PLAY THE GAME OF MAXIMIZING R-SQUARED OR ADJUSTED R-SQUARED!!!!
5. The Standard Error of �1 in a model with two independent variables SE (�1�hat) =
{[S(ei)2 / (n-3)] /
[S(X1 � mean of X )2 *(1-(r12)2)]} 0.5
Elements
Residual sum of squares: S(ei)2
Number of observations: n
Total sum of squares of X: S(X1 � mean of X )2
Correlation coefficient squared between X1 and X2 or the r-squared if you regressed X1 on X2.
6. Details of Standard Error Formula If n increases � the denominator will rise unambiguously (because the TSS of X must rise with more observations), but because a higher n increases both S(ei)2 (or the RSS of the model) and n (obviously), the numerator may or may not increase.
Result: Increase n and the standard error of the �1�hat will fall.
What if the residual sum of squares {S(ei)2} rises, holding n constant? Then the standard error will rise.
What if the total sum of squares of the X variable{S(X1 � mean of X )2} increases? Then the standard error will fall.
In other words, the more variation in X, or the more information we have about X, the better will be our estimate.
What if there is strong correlation between X1 and X2? Then the standard error will rise.
7. Null vs. Alternative Hypothesis The Null Hypothesis (H0): a statement of the range of values of the regression coefficient that would be expected if the researcher�s theory were NOT correct.
The Alternative Hypothesis (HA): a statement of the range of values of the regression coefficient that would be expected if the researcher�s theory were correct.
8. Some basic language We are trying to control for the probability of rejecting the null hypothesis when it is in fact true. We cannot control for the probability of accepting the null hypothesis when it is in fact false. Hence we do not accept the null hypothesis, rather we cannot reject the null hypothesis.
9. The t-statistic t1 = (�1 - �H0) / SE(�1)
Since typically the border value for the null hypothesis is zero.
In other words, our null hypothesis is that the coefficient has a value of zero.
Given this null�. the t-stat is generally the coefficient / standard error. It is this value the computer packages will report.
10. Judging the significance of a variable The t-statistic: estimated coefficient / standard deviation of the coefficient.
The t-statistic is used to test the null hypothesis (H0) that the coefficient is equal to zero. The alternative hypothesis (HA) is that the coefficient is different than zero.
Rule of thumb: if t>2 we believe the coefficient is statistically different from zero. WHY?
Understand the difference between statistical significance and economic significance.
11. The p-value p value = probability value
observed or exact level of significance
exact probability of committing a Type I error
the lowest significance level at which a null hypothesis can be rejected.
Level of significance: Indicates the probability of observing the estimated t-value greater than the critical t-value if the null hypothesis were correct.
Level of confidence: Indicates the probability that the alternative hypothesis is correct if the null hypothesis is rejected.
One can state either: The coefficient has been shown to be significant at the 10% level of significance or the 90% level of confidence.
12. Limitations of t-test The t-test does not test theoretical validity
The t-test does not test importance
The t-test is not intended for tests of the entire population
13. More on t-test The t-test does not test coefficients jointly.
Because �1 and �2 are statistically different than zero it does not tell us that �1 and �2 are jointly different than zero.
14. The F-Test A method of testing a null hypothesis that includes more than one coefficient
It works by determining whether the overall fit of an equation is significantly reduced by constraining the equation to conform to the null hypothesis.
15. The Test of Overall Significance H0: �1 = �2 = ....... �k = 0
The R2 is not a formal test of this hypothesis.
HA : Ho is not true.
F = [ESS/(k)] / [RSS / (n-k-1)]
Intuition: We are testing whether or not the variation in X1, X2, .... Xk explains more of Y than the random forces represented by error term.
Refer to the corresponding p-value of the F-test to answer this question.