Download
1 / 14
140 likes | 556 Vues
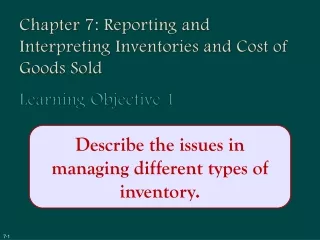
Reporting and Interpreting Cost of Goods Sold and Inventory. Chapter 7. McGraw-Hill/Irwin. © 2009 The McGraw-Hill Companies, Inc. Merchandiser. Merchandise Purchases. Merchandise Inventory. Cost of Goods Sold. Manufacturer. Raw Materials. Raw Materials Inventory.

E N D
Reporting and Interpreting Cost of Goods Sold and Inventory Chapter 7 McGraw-Hill/Irwin © 2009 The McGraw-Hill Companies, Inc.
Merchandiser MerchandisePurchases MerchandiseInventory Cost ofGoods Sold Manufacturer RawMaterials Raw MaterialsInventory Work in ProcessInventory Finished GoodsInventory DirectLabor Cost ofGoods Sold FactoryOverhead Flow of Inventory Costs
Nature of Cost of Goods Sold BeginningInventory Purchasesfor the Period Goods availablefor Sale Cost of Goods Sold(Income Statement) Ending Inventory(Balance Sheet) Beginning inventory + Purchases = Goods Available for Sale Goods Available for Sale – Ending inventory = Cost of goods sold
Inventory Costing Methods Inventory Costing Methods Specific Identification First-in, First-out Last-in, First-out Weighted Average Total Dollar Amount of Goods Available for Sale Inventory Costing Method Ending Inventory Cost of Goods Sold
When units are sold, the specific cost of the unit sold is added to cost of goods sold. Specific Identification
First-In, First-Out Method Cost of Goods Sold Oldest Costs Ending Inventory Recent Costs
Last-In, First-Out Method Ending Inventory Oldest Costs Cost of Goods Sold Recent Costs
When a unit is sold, the average cost of each unit in inventory is assigned to cost of goods sold. ÷ Cost of Goods Available for Sale Number of Units Available for Sale Average Cost Method
Smoothes out price changes. Ending inventory approximates current replacement cost. Better matches current costs in cost of goods sold with revenues. Financial Statement Effects of Costing Methods Advantages of Methods First-In, First-Out Last-In, First-Out Weighted Average
Valuation at Lower of Cost or Market Ending inventory is reported at the lower of cost or market (LCM). Replacement CostThe current purchase price for identical goods. The company will recognize a “holding” loss in the current period rather than the period in which the item is sold.This practice is conservative.
Internal Control of Inventory Separation of inventory accounting and physical handling of inventory. Storage in a manner that protects from theft and damage. Limiting access to authorized employees. Maintaining perpetual inventory records. Comparing perpetual records to periodic physical counts.
Perpetual and Periodic Inventory Systems Provides up-to-date inventory records. Perpetual System Provides up-to-date cost of sales records. In a periodic inventory system, ending inventory and cost of goods sold are determined at the end of the accounting period based on a physical count.