Download
1 / 15
170 likes | 375 Vues
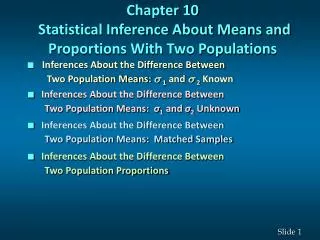
STATISTICAL INFERENCE ABOUT MEANS AND PROPORTIONS WITH TWO POPULATIONS. STATISTICS IN PRACTICE. The testing process in the pharmaceutical industry usually consists of three stages : 1.preclinical testing 2.testing for long-term usage and safety 3.clinical efficacy testing.

E N D
STATISTICAL INFERENCE ABOUT MEANS AND PROPORTIONS WITH TWO POPULATIONS
STATISTICS IN PRACTICE • The testing process in the pharmaceutical industry usually consists of three stages : • 1.preclinical testing • 2.testing for long-term usage and safety • 3.clinical efficacy testing
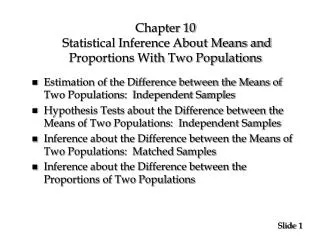
10.1 ESTIMATION OF THE DIFFERENCE BETWEEN THE MEANS OF TWO POPULATINS:INDEPENDENTSAMPLES • Point Estimator of the Difference Between the Means of populations • (10.1) • Sampling Distribution of • Expected Distribution of • (10.2) • (10.3)
Interval Estimate of :large-samplecase • Interval Estimate of the Difference Between the Means of Two Populations: Large-Sample Case • (10.4) • Point Estimator of • (10.5)
Interval Estimate of the Difference Between the Means of Two Population: Large-Sample Case With and Estimated by and(10.6)
Interval Estimate of :Small-Sample Case • We beginby making the following assumption: • 1.Both populations have normal distributions • 2.The variances of the populations are equal • (10.7)
Pooled estimator of(10.8)Point Estimate of When(10.9)
Interval Estimate of the DifferenceBetween the Means of Two Populations:Small-Sample Case With and Estimated by and(10.10)
10.2HYPOTHESIS TESTS ABOUT THE DIFFERENCE BETWEEN THE MEANS OF TWO POPULATIONS :INDIFFERENT SAMPLE • Large-sample Case • (10.11)
10.3 INFERENCES ABOUT THE DIFFERENCE BETWEEN THE MEANS OF TWO POPULATIONS:MATCHD SAMPLE • In choosing the sampling procedure that will be used to collect production time data and test the hypotheses ,we consider two alternative designs: • 1.Independent sample design • 2.Matched sample design • (10.13)
10.4 INFERENCES ABOUT THE DIFFERENCE BETWEEN THE PROPORTIONS OF TWO POPULATIONS • Point Estimator of the difference Between the Proportions of Two Populations • (10.14)
Sampling Distribution of • Expected Value: (10.15) • Standard deviation: (10.16)
Interval Estimation of • Point Estimator of • (10.17) • Interval Estimate of the Difference Between the Two Populations: Large-Sample Case With • (10.18)
Hypothesis Tests About • (10.19) • (10.20) • (10.21)