Download
1 / 74
770 likes | 1.02k Vues
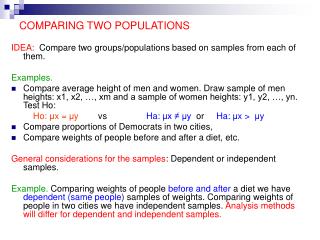
Inference about Comparing Two Populations. Chapter 13. 13.1 Introduction. Variety of techniques are presented whose objective is to compare two populations. We are interested in: The difference between two means. The ratio of two variances. The difference between two proportions.

E N D
Inference about ComparingTwo Populations Chapter 13
13.1 Introduction • Variety of techniques are presented whose objective is to compare two populations. • We are interested in: • The difference between two means. • The ratio of two variances. • The difference between two proportions.
13.2 Inference about the Difference between Two Means: Independent Samples • Two random samples are drawn from the two populations of interest. • Because we compare two population means, we use the statistic .
The Sampling Distribution of • is normally distributed if the (original) population distributions are normal . • is approximately normally distributed if the (original) population is not normal, but the samples’ size is sufficiently large (greater than 30). • The expected value of is m1 - m2 • The variance of is s12/n1 + s22/n2
Making an inference about m1– m2 • If the sampling distribution of is normal or approximately normal we can write: • Z can be used to build a test statistic or a confidence interval for m1 - m2
Making an inference about m1– m2 • Practically, the “Z” statistic is hardly used, because the population variances are not known. t S22 S12 ? ? • Instead, we construct a t statistic using the • sample “variances” (S12 and S22).
Making an inference about m1– m2 • Two cases are considered when producing the t-statistic. • The two unknown population variances are equal. • The two unknown population variances are not equal.
Example: s12 = 25; s22 = 30; n1 = 10; n2 = 15. Then, Inference about m1– m2: Equal variances • Calculate the pooled variance estimate by: The pooled variance estimator n2 = 15 n1 = 10
Example: s12 = 25; s22 = 30; n1 = 10; n2 = 15. Then, Inference about m1– m2: Equal variances • Calculate the pooled variance estimate by: The pooled Variance estimator n2 = 15 n1 = 10
Build a confidence interval or 0 Inference about m1– m2: Equal variances • Construct the t-statistic as follows: • Perform a hypothesis test • H0: m1 - m2 = 0 • H1: m1 - m2 > 0 or < 0
Inference about m1– m2: Unequal variances Conduct a hypothesis test as needed, or, build a confidence interval
Which case to use:Equal variance or unequal variance? • Whenever there is insufficient evidence that the variances are unequal, it is preferable to perform the equal variances t-test. • This is so, because for any two given samples The number of degrees of freedom for the equal variances case The number of degrees of freedom for the unequal variances case ³
Example: Making an inference about m1– m2 • Example13.1 • Do people who eat high-fiber cereal for breakfast consume, on average, fewer calories for lunch than people who do not eat high-fiber cereal for breakfast? • A sample of 150 people was randomly drawn. Each person was identified as a consumer or a non-consumer of high-fiber cereal. • For each person the number of calories consumed at lunch was recorded.
Example: Making an inference about m1– m2 • Solution: • The data are interval. • The parameter to be tested is • the difference between two means. • The claim to be tested is: • The mean caloric intake of consumers (m1) • is less than that of non-consumers (m2).
Example: Making an inference about m1– m2 • The hypotheses are: • H0: (m1 - m2) = 0 • H1: (m1 - m2) < 0 • To check the whether the population variances are equal, we use (Xm13-01) computer output to find the sample variances We have s12= 4103, and s22 = 10,670. • It appears that the variances are unequal.
Example: Making an inference about m1– m2 • Compute: Manually • From the data we have:
Example: Making an inference about m1– m2 • Compute: Manually • The rejection region is t < -ta,n = -t.05,123 @ -1.658
.0193 < .05 -2.09 < -1.6573 Example: Making an inference about m1– m2 At the 5% significance level there is sufficient evidence to reject the null hypothesis. Xm13-01
Example: Making an inference about m1– m2 • Compute: Manually The confidence interval estimator for the differencebetween two means is
Example: Making an inference about m1– m2 • Example 13.2 • An ergonomic chair can be assembled using two different sets of operations (Method A and Method B) • The operations manager would like to know whether the assembly time under the two methods differ.
Example: Making an inference about m1– m2 • Example 13.2 • Two samples are randomly and independently selected • A sample of 25 workers assembled the chair using method A. • A sample of 25 workers assembled the chair using method B. • The assembly times were recorded • Do the assembly times of the two methods differs?
Example: Making an inference about m1– m2 Assembly times in Minutes • Solution • The data are interval. • The parameter of interest is the difference • between two population means. • The claim to be tested is whether a difference • between the two methods exists.
Example: Making an inference about m1– m2 • Compute: Manually • The hypotheses test is: • H0: (m1 - m2) = 0 H1: (m1 - m2) ¹ 0 • To check whether the two unknown population variances areequal we calculate S12 and S22 (Xm13-02). • We have s12= 0.8478, and s22=1.3031. • The two population variances appear to be equal.
Example: Making an inference about m1– m2 • Compute: Manually • To calculate the t-statistic we have:
Rejection region Rejection region Example: Making an inference about m1– m2 • The rejection region is t < -ta/2,n =-t.025,48 = -2.009 or t > ta/2,n = t.025,48 = 2.009 • The test: Since t= -2.009 < 0.93 < 2.009, there is insufficient evidence to reject the null hypothesis. For a = 0.05 .093 2.009 -2.009
-2.0106 < .93 < +2.0106 .3584 > .05 Example: Making an inference about m1– m2 Xm13-02
Example: Making an inference about m1– m2 • Conclusion: There is no evidence to infer at the 5% significance level that the two assembly methods are different in terms of assembly time
Example: Making an inference about m1– m2 A 95% confidence interval for m1 - m2 is calculated as follows: Thus, at 95% confidence level -0.3176 < m1 - m2 < 0.8616 Notice: “Zero” is included in the confidence interval
Design A Design B Checking the required Conditions for the equal variances case (Example 13.2) The data appear to be approximately normal
13.4 Matched Pairs Experiment • What is a matched pair experiment? • Why matched pairs experiments are needed? • How do we deal with data produced in this way? The following example demonstrates a situation where a matched pair experiment is the correct approach to testing the difference between two population means.
Group 1Group 2 Difference 10 12 - 2 15 11 +4 Mean1 =12.5 Mean2 =11.5 Mean1 – Mean2 = 1 Mean Differences = 1 The matched pairs experiment • Since the difference of the means is equal to the mean of the differences we can rewrite the hypotheses in terms of mD (the mean of the differences) rather than in terms of m1 – m2. • This formulation has the benefit of a smaller variability.
The matched pairs experiment • Example 13.4 • It was suspected that salary offers were affected by students’ GPA, (which caused S12 and S22 to increase). • To reduce this variability, the following procedure was used: • 25 ranges of GPAs were predetermined. • Students from each major were randomly selected, one from each GPA range. • The highest salary offer for each student was recorded. • From the data presented can we conclude that Finance majors are offered higher salaries?
Finance Marketing The matched pairs hypothesis test • Solution (by hand) • The parameter tested is mD (=m1 – m2) • The hypotheses:H0: mD = 0H1: mD > 0 • The t statistic: The rejection region is t > t.05,25-1 = 1.711 Degrees of freedom = nD – 1
The matched pairs hypothesis test • Solution • From the data (Xm13-04) calculate:
The matched pairs hypothesis test • Solution • Calculate t
3.81 > 1.7109 .0004 < .05 The matched pairs hypothesis test Xm13-04
The matched pairs hypothesis test Conclusion: There is sufficient evidence to infer at 5% significance level that the Finance MBAs’ highest salary offer is, on the average, higher than that of the Marketing MBAs.
The matched pairs mean difference estimation Using Data Analysis Plus Xm13-04 First calculate the differences, then run the confidence interval procedure in Data Analysis Plus.
Checking the required conditionsfor the paired observations case • The validity of the results depends on the normality of the differences.
13.5 Inference about the ratio of two variances • In this section we draw inference about the ratio of two population variances. • This question is interesting because: • Variances can be used to evaluate the consistency of processes. • The relationship between population variances determines which of the equal-variances or unequal-variances t-test and estimator of the difference between means should be applied
Parameter and Statistic • Parameter to be tested is s12/s22 • Statistic used is • Sampling distribution of s12/s22 • The statistic [s12/s12] / [s22/s22] follows the F distribution with n1 = n1 – 1, and n2 = n2 – 1.
Under this null hypothesis the F statistic becomes S12/s12 F = S22/s22 Parameter and Statistic • Our null hypothesis is always H0: s12 / s22 = 1
The hypotheses are: H0: H1: Testing the ratio of two population variances Example 13.6 (revisiting Example 13.1) (see Xm13-01) In order to perform a test regarding average consumption of calories at people’s lunch in relation to the inclusion of high-fiber cereal in their breakfast, the variance ratio of two samples has to be tested first. Calories intake at lunch
Testing the ratio of two population variances • Solving by hand • The rejection region is F>Fa/2,n1,n2 or F<1/Fa/2,n2,n1 • The F statistic value is F=S12/S22 = .3845 • Conclusion: Because .3845<.58 we reject the null hypothesis in favor of the alternative hypothesis, and conclude that there is sufficient evidence at the 5% significance level that the population variances differ.