Download
1 / 20
200 likes | 208 Vues
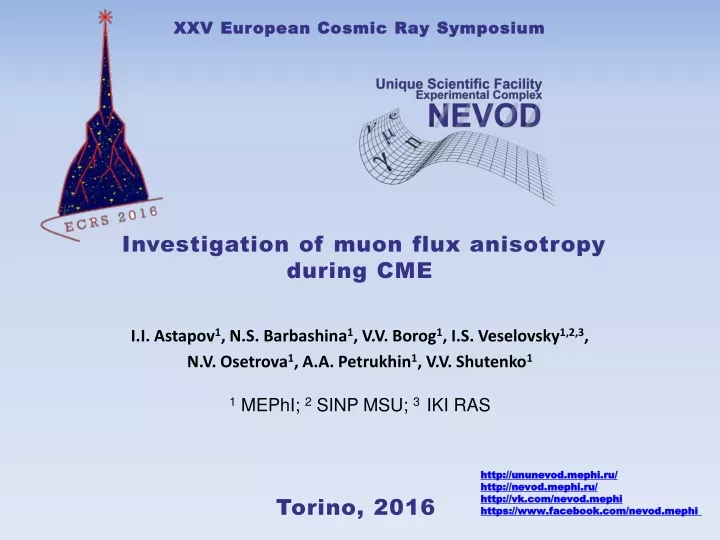
XXV European Cosmic Ray Symposium. Investigation of muon flux anisotropy during CME. I.I. Astapov 1 , N.S. Barbashina 1 , V.V. Borog 1 , I.S. Veselovsky 1 ,2,3 , N.V. Osetrova 1 , A.A. Petrukhin 1 , V.V. Shutenko 1 1 MEPhI ; 2 SINP MSU ; 3 IKI RAS. http://ununevod.mephi.ru/

E N D
XXV European Cosmic Ray Symposium Investigation of muon flux anisotropy during CME I.I. Astapov1, N.S. Barbashina1, V.V. Borog1, I.S. Veselovsky1,2,3, N.V. Osetrova1, A.A. Petrukhin1, V.V.Shutenko1 1MEPhI; 2SINP MSU; 3 IKI RAS http://ununevod.mephi.ru/ http://nevod.mephi.ru/ http://vk.com/nevod.mephi https://www.facebook.com/nevod.mephi Torino, 2016
Muon hodoscope URAGAN URAGAN (55.7°N, 37.7°E, 173 m above sea level) is the coordinate detector that allows to investigate the variations of the muon flux angular distribution on the Earth’s surface. URAGAN consists of four independent supermodules (SM), total area ~46 m2. Each SM is assembled of 8 layers of gas-discharge chambers (streamer tubes) equipped with two-coordinate system of external readout strips which provides a high spatial and angular accuracy of muon track detection (correspondingly, 1 cm and 1°) in a wide range of zenith (0°-80°) and azimuthal (0°-360°) angles in the real time mode. Every minute, angular distribution of muons is recorded in a two-dimensional angular matrix, which represents a muonography of the upper hemisphere with one-minute exposure.
Experimental data To study the URAGAN integral counting rate, 10-min data summed over all modules and corrected for the barometric and temperature effects are used. Local anisotropy vector For the study of two-dimensional variations of muon flux registered by the URAGAN, a local anisotropy vector A is used. Local anisotropy vector indicates the average arrival direction of muons which is close to the vertical. To study its deviations from the mean value, the relative anisotropy vector r and its horizontal projection rhare used:
Coronal mass ejections CACTus CME list Automatically generated by CACTus using LASCO C2/C3 observations. Parameters: # t0: onset time, earliest indication of liftoff # dt0: duration of liftoff (hours) # pa: principal angle, counterclockwise from North (degrees) # da: angular width (degrees), # v: median velocity (km/s) # dv: variation (1 sigma) of velocity over the width of the CME # minv: lowest velocity detected within the CME # maxv: highest velocity detected within the CME # halo?: II if da>90, III if da>180, IV if da>270, indicating potential halo/partial halo CME During the maximum of the solar activity cycle 2012-2015 – more than 100 CMEs/month During the minimum of the solar activity cycle 2008-2009 – about 10 – 30 CMEs/month http://sidc.oma.be/cactus/catalog.php
Selection of CMEs VCME > 500 km/s From 2008 to 2015, there were 2237 CMEs with the velocity more than 500 km/s Dt0_CME – the time difference between the beginning of two CMEs If Dt0_CME < 24 hour, the events are combined into a group
Summary of data for calculating speed and beginning time of the group By the number of CME in a group, the events are classified as: • Single CME • Weak group (2 – 4 CME) • Average group(5-10 CME) • Powerful group (> 10 CME)
Results Powerful groups Average groups Weak groups Single CMEs
iNTEGRATED SPACE WEATHER ANALYSIS SYSTEM (iSWA) http://iswa.ccmc.gsfc.nasa.gov/ The density distribution in the interplanetary space The velocity distribution in the interplanetary space
Is the CME geoeffective? OMNI data: The time Δt during which the CME passed a distance of 2 a.u. was estimated for each event. Then, according to the OMNI data the average values of the magnetic field B, solar wind velocity V and Kp-index in the time interval t0+Δt (t0 – time of the CME beginning according to the CACTus were calculated. The obtained values of <B> and <Vsw> (considering their spread) did not exceed the average values calculated for the period of the IMF and solar wind observations from 2005 to 2015. For all events, Kp-index did not exceed 4.
«Geoeffective» CME CACTus: LASCO: STEREO-B: 2014/09/10 18:48 V ~ 1100 km/s 2 а.u. ~ 3 days iSWA:
2014/09/10 OMNI: URAGAN: AFD ~ 1.5 %:
«Geoeffective» CME CACTus: STEREO LASCO: 2015/06/21 02:48 V ~ 1200 km/s 2 а.u. ~ 3 days iSWA:
2015/06/21 OMNI: AFD ~ 2.7 %: URAGAN :
«Non-geoeffective» CME CACTus: LASCO: 2015/03/10 3:36 V ~ 760 km/s 2 a.u. ~ 4.5 days iSWA:
2015/03/10 OMNI: URAGAN:
«Weak non-geoeffective» CME 2015/02/10 01:48 V ~ 405 km/s
Among 14 non-geoeffective CMEs, 6 CMEs were observed in the response of the muon flux anisotropy according to the URAGAN data. At the same time, during such events no changes in the counting rates were observed. During geoeffective CMEs, Forbush decreases are usually observed. The changes of muon flux local anisotropy values were observed in 9 of 12 events. In total, 26 CMEs occurred in 2014 and 2015 were considered. 14 of them were classified as non-geoeffective
Conclusion Registration of muons in the hodoscopic mode allows studying with a single setupnot only the intensity of cosmic ray flux, but also its local anisotropy sensitive to changes in the heliosphere. Non-geoeffective CMEs have a small effect on themuon hodoscope response . The presented approach to the study of CMEs will become the basis of a new method for identification of geoeffective events. This work was performed at the Unique Scientific Facility “Experimental complex NEVOD” in Moscow Engineering Physics Institute.