1 / 1

P-P Plot of the variable Log ( N ob /N exp )

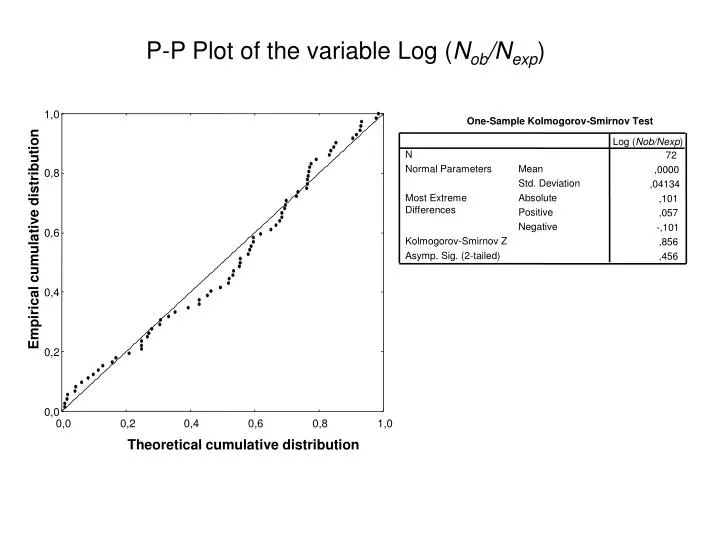
P-P Plot of the variable Log ( N ob /N exp ). 1,0. One-Sample Kolmogorov-Smirnov Test. Log ( Nob/Nexp ). N. 72. Normal Parameters. Mean. ,0000. 0,8. Std. Deviation. ,04134. Most Extreme. Absolute. ,101. Differences. Positive. ,057. Negative. -,101. 0,6.

brick
Télécharger la présentation

P-P Plot of the variable Log ( N ob /N exp )

An Image/Link below is provided (as is) to download presentation Download Policy: Content on the Website is provided to you AS IS for your information and personal use and may not be sold / licensed / shared on other websites without getting consent from its author. Content is provided to you AS IS for your information and personal use only. Download presentation by click this link. While downloading, if for some reason you are not able to download a presentation, the publisher may have deleted the file from their server. During download, if you can't get a presentation, the file might be deleted by the publisher.

E N D

Presentation Transcript


  1. P-P Plot of the variable Log (Nob/Nexp) 1,0 One-Sample Kolmogorov-Smirnov Test Log (Nob/Nexp) N 72 Normal Parameters Mean ,0000 0,8 Std. Deviation ,04134 Most Extreme Absolute ,101 Differences Positive ,057 Negative -,101 0,6 Empirical cumulative distribution Kolmogorov-Smirnov Z ,856 Asymp. Sig. (2-tailed) ,456 0,4 0,2 0,0 0,0 0,2 0,4 0,6 0,8 1,0 Theoretical cumulative distribution

More Related