Download
1 / 37
370 likes | 502 Vues
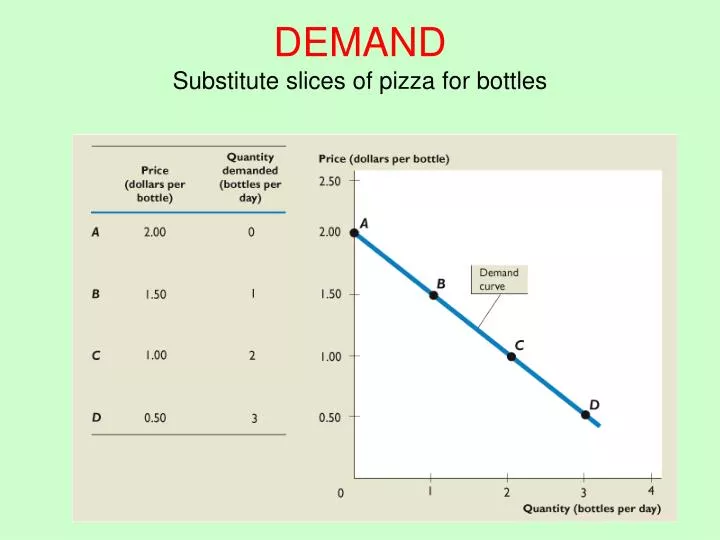
DEMAND Substitute slices of pizza for bottles. MARKET DEMAND Substitute slices of pizza for bottles. SUPPLY Substitute slices of pizza for bottles. MARKET SUPPLY Substitute slices of pizza for bottles. MARKET EQUILIBRIUM Substitute slices of pizza for bottles. Q demanded = Q supplied.

E N D
MARKET DEMAND Substitute slices of pizza for bottles
MARKET EQUILIBRIUMSubstitute slices of pizza for bottles Qdemanded = Qsupplied “Economic Efficiency” How demonstrate this? Welfare Economics
Two ways to look @ Demand Curve Price Price “Willingness to Purchase” “Willingness to Pay” $2 $2 D D Quantity 3 Quantity 3
“Willingness to Pay” Price willing to pay is a measure of the benefit received Price Because we are examining the last coke purchased, we are measuring the “MarginalBenefit” received from the last coke Quantity
MARGINAL BENEFIT Price S $1 D = MB Quantity
Consumer Surplus Price Total of all marginal Benefits = Total Consumer Benefit CONSUMER SURPLUS $1 D = MB Quantity
Producer Surplus Price $1 Quantity
Producer Surplus Price S = MC $1 PRODUCER SURPLUS Quantity
Price S = MC $1 PRODUCER SURPLUS Quantity
Total Social Surplus Price CONSUMER SURPLUS TOTAL SOCIAL SURPLUS $1 PRODUCER SURPLUS Quantity
Proving “Efficiency” of Markets Price CONSUMER SURPLUS Reduction in Total Social Surplus $2 $1 PRODUCER SURPLUS Quantity
Proving “Efficiency” of Markets Price S = MC MC > MB Reduces total Social Benefit CONSUMER SURPLUS $1 PRODUCER SURPLUS D = MB Quantity
Price S = MC CONSUMER SURPLUS $1 PRODUCER SURPLUS D = MB Quantity Maximum Social Benefit@ Market Equilibrium “Efficiency of Markets”
Given Society’s Demand reflection (measurement) of how it values things ie, how “willing to pay” Costs of Producing Then can not achieve Social Benefit, or happiness by Or quantity produced What Have We Proven? Price S = MC CONSUMER SURPLUS $1 PRODUCER SURPLUS D = MB Quantity
Price S = MC CONSUMER SURPLUS $1 PRODUCER SURPLUS D = MB Quantity Maximum Social Benefit@ Market Equilibrium “Efficiency of Markets” But, What is Missing in this picture?
Supply curve based on Production Costs Labor, materials, depreciation “write a check” “Internal” Costs BUT also Environmental Costs Pollution of air & water, loss of wetlands, soil damage from Irrigation “External” to firm producing But, “Real” costs to society ATC MC Price S = MC $1 Quantity Other Costs?
How Value ? Chpt 6 Assume we have their value Add to Firm’s Existing Costs New Equilibrium Higher Price Lower Quantity EXTERNAL COSTS Price S’ = MSC S = MC P2 p1 D Quantity q2 q1
Need Mechanism to Internalize “external” costs Tax “market” based solution How Achieve Lower Quantity? Price S’ = MC + tax = MSC S = MC P2 p1 Quantity q2 q1
Government Regulation Both 1 & 2 are mechanisms to internalize “external” costs How Achieve Lower Quantity? Price S’ = MSC S = MC p1 Quantity q2 q1
Market Equilibrium & “Efficiency” Price S = MC CONSUMER SURPLUS $1 PRODUCER SURPLUS Accruing to owner or buyer Marginal “private” benefits D = MB Quantity
Third Party Benefits (people not involved in market transaction) People living around airports universities parks “Social Benefits” EXTERNAL BENEFITS (external to the market) How value? Chpt 6 How Achieve larger Q? Market Equilibrium & “Efficiency” Other Benefits? Price S = MC CONSUMER SURPLUS $1 PRODUCER SURPLUS D’ = MSB D = MPB Marginal private benefits Quantity q1 q2
Need Mechanism to Internalize “external” benefits Cost to Supply the good: Tax breaks Subsidies airports land preserves parks How Achieve larger Q? Price S = MC CONSUMER SURPLUS P1 PRODUCER SURPLUS P2 D = MB Quantity q2 q1
Figure 3-6: Welfare Analysis of the Automobile Market with Pollution Costs
“Efficiency” with Externalities the case of “Optimal” pollution Price S’ w/ external social costs Up to q1 pollution permitted Social benefits of driving > combined costs of production & pollution S = MpC p0 D = MpB Quantity q1 q0
“optimal pollution permitted. Ironic conclusion of Traditional Environmental Econ based on Neoclass market economics We’ve used econ theory to prove pollution OK! Implication of demand for cars? Price S’ w/ external social costs S = MpC p0 D’ D = MpB Quantity q1 q0
Lecture 4 Discussion Question Should our goal be to reduce pollution by 50%, 75%, or 100% ?? Explain your answer.
Price S = MC CONSUMER SURPLUS $1 PRODUCER SURPLUS D = MB Quantity
Price Total of all marginal Benefits = Total Consumer Benefit Quantity
MC ATC