Download
1 / 25
250 likes | 402 Vues
The ST7 Interferometer Andreas Kuhnert Robert Spero Jet Propulsion Laboratory California Institute of Technology. ST7 Concept. Measure suspended masses within spacecraft Test thruster performance in drag-free control Hitch ride on LISA Pathfinder. x 1. x 2. Optical bench. TM1. TM2.

E N D
The ST7 InterferometerAndreas KuhnertRobert SperoJet Propulsion LaboratoryCalifornia Institute of Technology
ST7 Concept • Measure suspended masses within spacecraft • Test thruster performance in drag-free control • Hitch ride on LISA Pathfinder x1 x2 Optical bench TM1 TM2 • Interferometer optical bench fixed to spacecraft • x1 and x2 measured separately; x1 + x2 is low-noise
Optical Bench 20 cm Intensity Monitor Beam-splitter TM1 TM2 Quadrant photodiode Sensitive path Collimator Insensitive path Optical Fiber
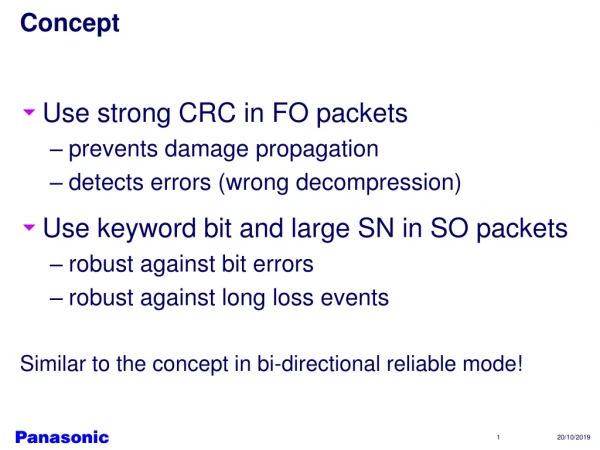
Interferometer Features Beam diameter 1 mm, Rayleigh range 70 cm, sensitive path lengths 10 cm. No modulators, phasemeters, intensity stabilization, or frequency stabilization. Requires test mass to be positioned near mid-fringe. Intensity monitored, noise removed in data analysis. Separate measurements of both bench/test-mass distances. Quadrant photodiodes monitor total fringe signal, and two axes of alignment. Automatic alignment, autonomous operation.
Homodyne Signal Optical Bench Thermal Expansion l/2 A B A B Manual Alignment
Testbed Noise 60 pm rms optical bench modulation 1000 Allocated noise 100 pm/rtHz 10 Measured noise 1 100 1 mHz
Measurements Demonstrate: Analog electronics and ADC noise adequately low Thermal sensitivity probably adequately low Bench motion suppression typically x200, without calibration (x1000 needed) Frequency stabilization not needed Intensity noise can be suppressed in data analysis
Alignment Sensitivity 1:Geometric error Dq Dq q0 s1 xc= p cosq xS= s1 sin q p Dxc= pq0Dq DxS= s1 Dq s1 = 40 m; p = 10 cm; q0 = 400 mrad Errors are correlated, and of same order: s1 ~ pq0
Alignment Sensitivity 2:Fringe position error Dq q0 p + x Dxx= ax q0Dq, a = (pw/l)2 =2.2x10⁶, w=beam radius
Total angle-jitter noise Fringe center error, 30 nm Misalignment, 400 mrad Transverse error, 40 mm Test mass jitter, 1 mrad/rthz Displacement noise, 30 pm/rthz
Initialization 1. Starting state 2. IFO finds bright fringe 4. IFO Aligns 3. GRS moves to quarter fringe 5. GRS to half fringe Position Intensity
Intensity Pattern with Misalignment • Horizontal misalignment shown. • Pattern insensitive to fringe offset near mid-fringe. • Sample with 4 pixels (quadrant photodiode). Difference/sum response: dQ/dq = sqrt(8kw/p3)
Static Misalignment and Static Longitudinal Error Fringe Visibility Error Sensitivity 1 w=0.5 mm w=1.0 mm Alignment noise w=2.0 mm Electronic noise 0 Misalignment (mrad) Bright Mid Dark