Download
1 / 7
70 likes | 219 Vues
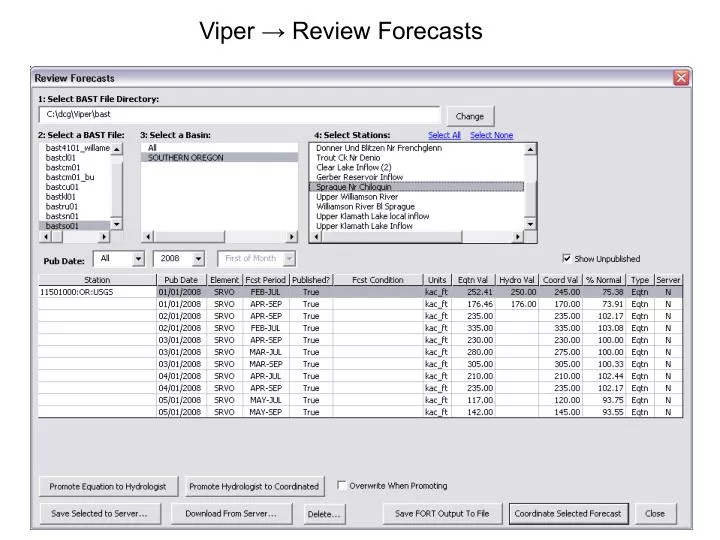
Viper → Review Forecasts. Viper → Reports → FMT Report. USDA NRCS National Water & Climate Center * - DATA CURRENT AS OF: April 03, 2008 08:48:51 AM - Based on April 01, 2008 forecast values SOUTHERN OREGON

E N D
USDA NRCS National Water & Climate Center * - DATA CURRENT AS OF: April 03, 2008 08:48:51 AM - Based on April 01, 2008 forecast values SOUTHERN OREGON 50% % of max 30% 70% min 30-yr Forecast Point period (KAF) avg (KAF) (KAF) (KAF) (KAF) avg -------------- ------ ------ ---- ------ ------ ------ ------ ------ Twentymile Ck nr Adel APR-JUL 17.4 103 31 23 11.8 3.7 16.9 APR-SEP 17.9 103 32 23 12.3 4.1 17.4 Deep Ck ab Adel APR-JUL 61 91 78 68 54 44 67 APR-SEP 63 91 81 70 56 45 69 Honey Ck nr Plush APR-JUL 16.6 101 23 19.1 14.1 10.5 16.4 APR-SEP 16.8 101 23 19.3 14.3 10.7 16.6 Chewaucan R nr Paisley APR-JUL 60 81 77 67 53 43 74 APR-SEP 64 82 81 71 57 47 78 Silver Ck nr Silver Lake (2) APR-JUL 7.5 52 11.3 9.0 6.0 3.7 14.5 APR-SEP 8.1 51 12.4 9.9 6.3 3.8 15.9 Silvies R nr Burns APR-JUL 137 143 181 155 119 93 96 APR-SEP 141 142 186 159 123 96 99 Donner Und Blitzen R nr Frenchglen APR-JUL 59 92 82 68 50 36 64 APR-SEP 64 91 88 74 54 40 70 Trout Ck nr Denio APR-JUL 9.6 100 13.9 11.4 7.8 5.3 9.6 APR-SEP 10.2 99 14.6 12.0 8.4 5.8 10.3 Max is 90th percentile and min is 10th percentile except with footnote 1 below. Averages are for the 1971-2000 period. All volumes are in thousands of acre-feet. footnotes: 1) max is 95th percentile and min is 5th percentile 2) streamflow is adjusted for upstream storage
Detailed Equation Output Report Chewaucan R nr Paisley APR-SEP VOLUME PUB DATE = 04/01/2008 PUB DAYS = 04/01 PUBLISHED = TRUE ELEM DATE SITE NAME I.D. COEF VALUE AVERAGE % LAST % ----------------------------------------------------------------------------------------- WTEQ 4/01 Silver Creek 756 0.95792 13.70 7.80 176 137 WTEQ 4/01 Strawberry 794 1.09822 6.90 4.10 168 153 PRCP -11 Quartz Mountain 706 2.04187 1.10 2.20 50 207 PRCP -12 Quartz Mountain 706 2.04187 1.70 1.90 89 50 PRCP 1 Quartz Mountain 706 2.04187 2.60 2.40 108 89 PRCP 2 Quartz Mountain 706 2.04187 0.90 2.20 41 108 PRCP 3 Quartz Mountain 706 2.04187 1.40 2.50 56 41 PRCP -11 Strawberry 794 2.12387 0.90 2.90 31 193 PRCP -12 Strawberry 794 2.12387 2.20 3.30 67 31 PRCP 1 Strawberry 794 2.12387 5.60 3.30 170 67 PRCP 2 Strawberry 794 2.12387 2.90 3.00 97 170 PRCP 3 Strawberry 794 2.12387 1.60 3.00 53 97 SRVOO 3 Sprague River Near C 11501000 0.24960 51.43 OI -10 Tni Climate Index TNI 1.26351 -0.90 OI -11 Tni Climate Index TNI 1.26351 -0.30 OI -12 Tni Climate Index TNI 1.26351 0.00 OI 1 Tni Climate Index TNI 1.26351 1.90 CONST -- INTERCEPT -- -14.07234 1.00 ID = 10384000 EQ FORECAST = 64.00 ( 82.1%) AVERAGE = 78.00 HYDROLOGIST WORK FORECAST = ( ) TRANSFORM = FINAL COORDINATED FORECAST = ( ) STDERR = 13.10 ( 10%) = 81.16 ( 104.1%) RECORD MAX = 167.66 ( 30%) = 70.94 ( 91.0%) RECORD MIN = 12.96 ( 70%) = 57.06 ( 73.2%) NWS FCST = ( 90%) = 46.84 ( 60.1%) STATE FCST =