Download
1 / 20
200 likes | 312 Vues
Peak Oil through the lens of a general equilibrium assessment. Henri WAISMAN , Julie ROZENBERG, Olivier SASSI and Jean-Charles HOURCADE (waisman@centre-cired.fr). 34 th IAEE International Conference Stockholm - 19/23 June 2011. Motivation.

E N D
Peak Oil through the lens of a general equilibrium assessment Henri WAISMAN, Julie ROZENBERG, Olivier SASSI and Jean-Charles HOURCADE (waisman@centre-cired.fr) 34th IAEE International Conference Stockholm - 19/23June 2011
Motivation • Peak Oil = impending stagnation and decline of world oil production • Determinants of Peak Oil : what drives the occurrence of Peak Oil? • Date of Peak Oil : a signal for the urgency of changes in energy uses • Economic consequences : sudden shocks and long-term effects
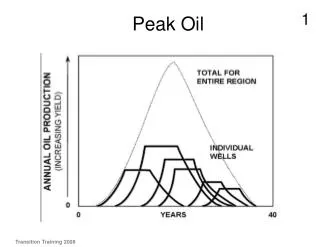
Motivation 2 largely disconnected strands of literature • Geological-based analyses of Peak Oil • Hubbert-like approach = bell-shaped production curves at the field level • Extrapolation at a global level is questionable • heterogeneous oil reserves and producers’ rationale • Economic dimensions of oil markets • Short-term effects of oil disruption • econometric analyses after first oil shock • no explicit accounting of resource depletion • Long-term effects of exhaustible resources exploitation • production profile under perfect foresight (Hotelling) • scarce representation of peaks
Objectives Representing the macroeconomic dimensions of long-term oil markets • Endogenizing Peak Oil from the interplay between determinants of long-term oil markets under inertia and imperfect anticipations • Oil supply, Liquid Fuels demand, Alternatives to oil • Representing the impact of the economy on oil markets • Consumer behavior driving oil demand in function of price signals • Investment decisions in production capacities of oil and alternatives in function of profitability prospects and capital availability • Capturing the feedback effects of oil markets on macroeconomy • Energy trade (energy security for oil-importers, exportation revenues) • Technical and structural change ( oil-dependency, industrialization) • Aggregate effects on economic activity and welfare
Approach (1) • A CGE approach embarking lessons from economic assessments of oil shocks • mark-up pricing instead of competitive markets to capture a set of market imperfections • partial utilization rate of capital due to the complementarity between energy and capital services • putty-clay description of capital (with fixed energy intensity for old vintages) capturing the effects of inertias in the renewal of productive capital • frictions in reallocating capital and labor across heterogeneous sectors (in terms of sensitivity to oil prices) causing differentiated levels of idle production capacities and unemployment.
Approach (2) • A hybrid bottom-up/top-down approach • sectoral modules embarking expert-based information on the direction and magnitude of technical change, including the determinants of oil markets • a dialogue between technical/behavioral determinants and macroeconomic interactions • A representation of « second-best »economies • missing, imperfect or distorted markets • noncompetitive behaviors • technical and institutional inertias • asymmetry or incompleteness of information
The IMACLIM-R model Static Equilibrium (t) under constraints Dynamic sub-modules (reduced forms of BU models) Static Equilibrium (t+1) under updated constraints ... Technical and structural parameters (i-o coefficients, population, productivity) Electricity Residential Transport Oil Supply Industry Economic signals (prices, quantities, Investments) Agricolture Energy Transport • Hybridmatrixes in values, energy and « physical » content (Mtoe, pkm) • Secure the consistency of the engineering based and economic analyses • Explicit accounting of inertias on equipement stocks • Technical asymptotes, basic needs • Solowiangrowthengine in the long run but transitorydisequilibrium • Unemployment, excesscapacities • Investmentsunderimperfectforesight (informed by sectoralmodels) • Trade and capital flowsunderexogenousassumption about debts
Modeling oil supply geological dimension • In each region, 7 categories of conventional + 5 categories of non-conventional reserves • size of the reservoir Q∞,i (ultimate reserves, including past production) • threshold selling price pi(0)above which production is profitable (proxy for costs of exploration/exploitation and accessibility) • Maximum rate of increase of production capacity for each category, given geological constraints bi: steepness of the bell-shape profile (default value: b=0.061) t0,i : expected date of the maximum for oil category i, given past production
Modeling oil supply producers’ decisions • All regions except Middle-East = “Fatal producers” • maximum deployment for profitable categories (poil> pi(0)) • investment stopped for non-profitable categories (poil < pi(0)) • Middle-East = “Swing producers” • Fill the gap between demand and other suppliers • World price depends on the utilization rate of production capacities • ME deployment of production capacities in function of their price objective • Total production capacity= sum over all categories and regions Production Capacity of oilcategory i Cap(t,i)+Δcapmax(t,i) Cap(t,i) time t t+1
Modelling oil demand • Liquid fuels’ demand (residential, industry, transport) • Utility and profit maximization under constraints • Short-term : inertia in the renewal of equipments and LBD • Long-term : consumption styles (preferences), technical potentials (technology availability, asymptotes), location patterns • Alternatives to oil • Biofuels • Competition over oil-based fuels: supply curves increasing with oil price • Asymptotes on BF production at a given year (competition of land uses) • Evolve in time to represent technical progress • Coal-To-Liquid • backstop technology with capacity constraints • enter the market at high oil price • production limited by the cumul of past investments
Results Two counterfactual scenarios of the world economy over 2010-2050 • different production capacity expansion in the short term • Market Flooding scenario • ME expands production capacities to maintain oil price at 2009 level • Intense demand in the short-term • Technical change towards oil-intensive patterns in the long term • Limited Deployment scenario • ME restricts capacity expansion to let short-term prices rise • Moderation of oil demand • Technical change towards oil-free patterns in the long term
ResultsPeak Oil profiles • Level • Date • Post-PO decrease Close dates but verydifferent time profiles!
ResultsWorld oil prices • Controlled by OPEC in the short-term • Sudden rise at the Peak Oil date • Continuous increase in long term due to constraints on CTL
ResultsTime profile of oil revenues • Short-term revenues controlled by price targets • Bubble of long-term profits triggered by price increase after PO Room for Short-term vs. Long-termtradeoff!
ResultsTradeoff for oil producers MF scenario profitable for oil producers at discount rates lower than 6%
Results Impacts on oil-importers (OECD) Close average growth but different time profiles
ResultsA sensitivity analysis on oil determinants • Amount of reserves • Low bound: 1.6Trillion bbl conventional+ 0.8Trillion bbl non-conventional • High bound: 2.3Trillion bbl conventional+ 1.2 Trillion bbl non-conventional • Inertia on non-conventional production • Low inertia: b=0.04 vs. high inertia: b=0.07
Conclusion • A model to frame the debate on Peak Oil and long-term oil markets • representing the interplay between geological and macroeconomic dimensions of long-term oil markets • endogenizing the date of Peak Oil from market interactions between oil supply, liquid fuels’ demand and alternatives to oil • analyzing the effects of alternative pricing strategies and various assumptions on reserves and non conventional production • assessing the indirect macroeconomic effects of Peak Oil on long-term economic growth trajectories
Conclusion • Some important messages • Oil pricing trajectories hardly affect the date of Peak Oil … but have important consequences on its macroeconomic effects (oil revenues, economic activity in oil importing countries) • strong variations of Peak Oil and related macroeconomic effects according to assumptions on oil reserves • Middle-East producers may prefer moderate short-term prices if they are able to bias technical change under imperfect foresight • High short-term oil prices may be beneficial in oil importing countries as a hedging strategy against long-term oil scarcity
Thank you for your attention! waisman@centre-cired.fr http://www.centre-cired.fr http://www.imaclim.centre-cired.fr/ 34th IAEE International Conference Stockholm - 19/23June 2011