Download
1 / 4
40 likes | 196 Vues
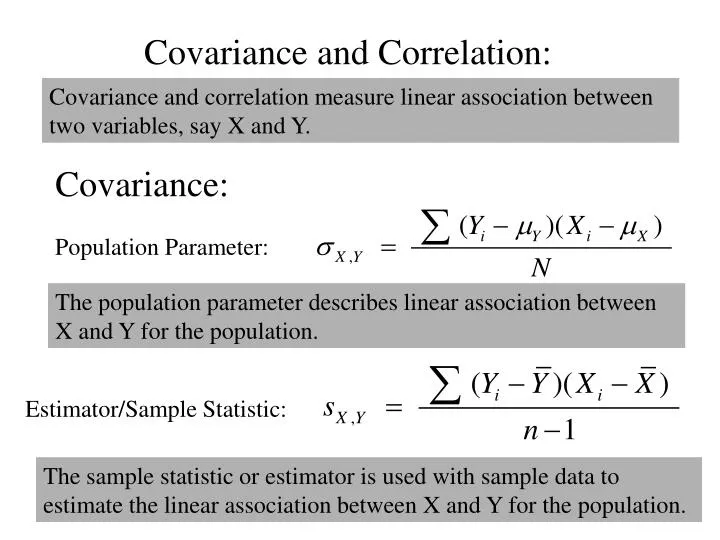
Covariance and correlation measure linear association between two variables, say X and Y. Covariance and Correlation:. Covariance:. Population Parameter:. The population parameter describes linear association between X and Y for the population. Estimator/Sample Statistic:.

E N D
Covariance and correlation measure linear association between two variables, say X and Y. Covariance and Correlation: Covariance: Population Parameter: The population parameter describes linear association between X and Y for the population. Estimator/Sample Statistic: The sample statistic or estimator is used with sample data to estimate the linear association between X and Y for the population.
Covariance • Create deviations for Y and deviations for X for each observation. • Form the products of these deviations. • The graph that follows illustrates these deviations. • In Quadrant 1, the products of deviations are positive. • In Quadrant 2, the products of deviations are negative. • Covariance – on average, what are the products of deviations? Are the positive or negative? • Covariance is not widely used, because the units are often confusing. We do need it for Portfolio Analysis – where all units are $.
Quadrant II Quadrant I Quadrant IV Quadrant III
Correlation measures the degree of linear association between two variables, say X and Y. There are no units – dividing covariance by the standard deviations eliminates units. Correlation is a pure number. The range is from -1 to +1. If the correlation coefficient is -1, it means perfect negative linear association; +1 means perfect positive linear association. Correlation: Population Parameter: Estimator/Sample Statistic: The sample statistic or estimator is used with sample data to estimate the linear association between X and Y for the population.