Download
1 / 18
180 likes | 296 Vues
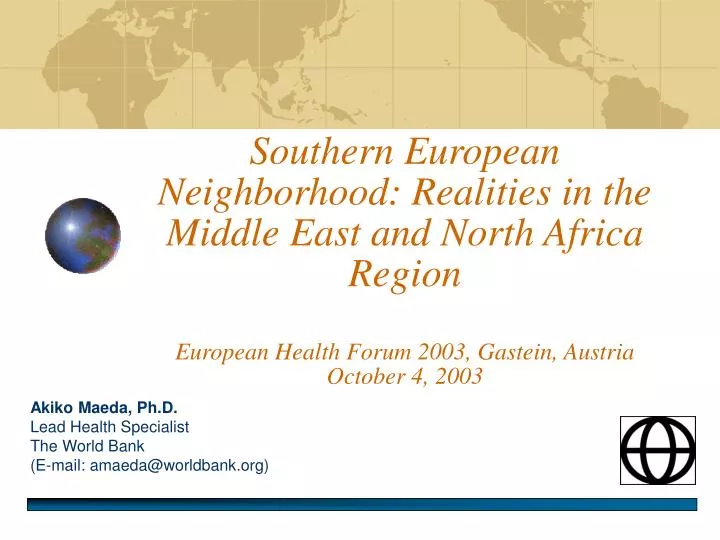
Akiko Maeda, Ph.D. Lead Health Specialist The World Bank (E-mail: amaeda@worldbank.org). Southern European Neighborhood: Realities in the Middle East and North Africa Region European Health Forum 2003, Gastein, Austria October 4, 2003. Middle East and North Africa Region.

E N D
Akiko Maeda, Ph.D. Lead Health Specialist The World Bank (E-mail: amaeda@worldbank.org) Southern European Neighborhood: Realities in the Middle East and North Africa RegionEuropean Health Forum 2003, Gastein, AustriaOctober 4, 2003
The Region in Brief….. • Some 20 countries, 307 millions population (2001): • Relatively wealthy, highly dependant on oil • Diverse income levels, wide disparities • 30 % of the population (87 millions) live under $2 per day • Geopolitically volatile region (5 % of world population, 25 % of conflicts)
Oil reserves (billion barrels, 2001) Crude oil production (million barrels per day, 2001) Proportion of oil reserves and production of crude oil 31 % 69 % 71 % 29 % 24.03 (MENA) 303.0 52.87 Irak 725.2 (MENA) Irak MENA Reste du Monde Sources: Crude Oil Production: IEA Oil Market Report Annual Statistical Supplement for 2001, August 2002, Table 11 (Bahrain information provided by DECPG); Petroleum Reserves: US Department of Energy Notes: Les pays de la région MENA inclus dans le graphique :’Arabie saoudite, Iran, Irak, Emirats Arabes Unis, Koweit, Bahrein, Qatar, Libye, Algérie, Oman, Syrie, Yémen, Egypte, et la zone neutre.
Exports as percentage of GDP, 2000MENA and Rest of the World MENA East Asia Europe/ High Latin South SubSaharan Pacific Central Income/ America Asia Africa Asia OECD Carib.
The Region in Brief….. • Young population, high unemployment rate, growing demand for social services • "Arab Development Report" (ADR 2002) a "mismatch between aspirations and their fulfillment has in some cases led to [Arab] alienation, apathy and discontent."
EU and MENA Demographics Source: United Nations Population Division
EU and Labor Migration • Since 1989, net migration is a main component of annual population change in EU. • In 2000, the annual net migration rate was 2.0 per 1 000 population, representing 65% of total population growth. • Around 5% of the EU population are non-nationals (3.4% non-EU nationals including MENA nationals).
The Region in Brief….. • MENA Region suffers from the three «deficits » • Lack of participation • Lagging in knowledge economy • Delays in women’s rights Source: UNDP Report on Human Development 2002 for Arab Region
Unemployment Rates, 1997* Iran Algérie Libye Liban Israel Maroc / Yémen (officiel) Tunisie Bahrein Jordanie Syrie Egypte Oman Koweit MENA MENA MENA East Asia Latin OECD South Sub-Saharan Total Non-GCC GCC & Pacific America High Asia Africa & Carib. income Note: * or more recent estimates.
Adult Illiteracy Rates(% aged 15 & above, 1998) Source: World Bank
Poverty National (% of population) 50 1980s 1990s 40 30 20 10 0 MENA Asie de l’Est Amérique Latine Asie Afrique sub- et Pacifique & Caraïbes du Sud Saharienne Source : Enquêtes sur la Pauvreté
Infant Mortality Rates, 2000 Deaths per 1000 live births Source: World Bank, WDI, 2002; UNICEF , The Situation of the Children in Iraq, 2002
Maternal Mortality Ratios Source: World Bank, WDI, 2002
Per Capita Health Spending Source: World Bank, WDI, 2002
Per Capita GDP vs. Per Capita Health Expenditure Source: World Bank, WDI, 2002
Inequities in Public Spending Share of government health expenditure (%) Gwatkin, 2001
Middle East and North Africa: Strategic Neighbor for EU • Major producer and exporter of oil • Major source of labor migration • Potential markets and trading partners • Politically volatile region in need of Human Development and institutional reforms