Download
1 / 30
300 likes | 304 Vues
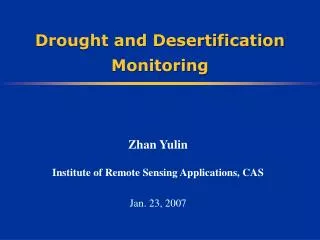
This article explores the use of AVHRR data to monitor drought and its impact on socioeconomic activities. It includes analysis on world population, grain production, global water use, vegetation products, weather, forestry, agriculture, climate, human health, water, NWS models, and ecosystems.

E N D
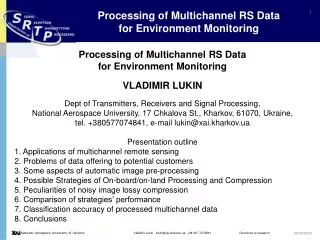
AVHRR Data for Monitoring Drought, Environment and Socioeconomic Activities Felix Kogan NOAA/NESDIS Office of Satellite Research and Applications 2005
Irrigated Agricultural Land 61-70 71-80 81-90 91-00 2900 4200 3400 3200
Vegetation Products WEATHER (droughts) FORESTRY (fire risk) AGRICULTURE (production) CLIMATE (ENSO) HUMAN HEALTH (epidemics) WATER (irrigation) NWS MODELS (vegetation fraction) ECOSYSTEMS (distribution & change)
DATA Sensor: Advanced Very High Resolution Radiometer (AVHRR) Satellites: NOAA-7, 9, 11, 14, 16 (afternoon), 17 (morning) Data Resolution:Spatial - 4 km GAC, sampled to 16 km; Temporal - 7-day composit Period: 1981-2005 Coverage:World (75 N to 55 S) Channels: VIS (ch1), NIR (ch2), Thermal (ch4, ch5)
NDVI shows vegetation distribution Brightness Temperature shows how hot is the surface
World Population Affected by Natural Disasters1967-1991 % Disaster Type Affected Killed Weather Drought5138 Flood 38 9 Hurricane etc. 8 27 Geological Earthquake 2 18 Volcano <1 <1
Drought 1988 Severe Moisture and Thermal Vegetation Stress
Major US Droughts1985-2000 Late season drought Late season drought Early season Drought, Winter Wheat affected Early season droughts in winter wheat is effected Mid-season drought, corn affected
Drought Dynamicsfrom Vegetation Health Index No Drought Drought
Area of Severe Drought Severe drought continued four years in a row covering more then 40% of a country
Wheat in Morocco from AVHRR-based VH & in situ data CHINA VH In Situ RUSSIA INDIA MONGOLIA KAZAKHSTAN ZIMBABWE ARGENTINA SOUTH AFRICA BRAZIL ETHIOPIA USA TURKMENISTAN POLAND Kogan 1990, 1997, 2001, 2002, 2003, 2004, 2005 HUNGARY
AGRICULTUREVegetation Health & Production POLAND BRAZIL KAZAHSTAN ARGENTINA ZIMBABWE REPUBLIC OF SOUTH AFRICA
Web http://www.orbit.nesdis.noaa.gov/smcd/emb/vci
Archive of Images Year W e e k Vegetation Health, AUSTRALIA
Conclusions Achievements • Vegetation Health Index (Combine NDVI and BT, Use climatology, Strong validation, Complete removal of high frequency noise) • Universal Drought Index • New Products (Fire risk, Diseases, Climate & trend, Irrigation, Soil surface saturation, Start/end of the growing season) WE need: * Continuity of sensors (AVHRR-MODIS-VIIRS) * Stability of time series (calibration, unusual events) * Climate trends * New products with predictive ability