Download
1 / 17
170 likes | 174 Vues
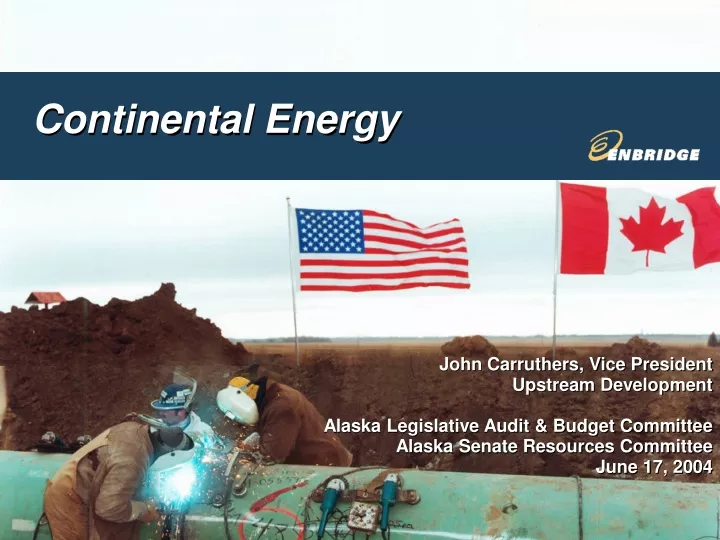
Continental Energy. John Carruthers, Vice President Upstream Development Alaska Legislative Audit & Budget Committee Alaska Senate Resources Committee June 17, 2004. 2003 Earnings. Inuvik. Internationa l. 13%. Norman Wells. Sponsored Investments. 8%. 40%. Crude Oil Pipelines. 27%.

E N D
Continental Energy John Carruthers, Vice President Upstream Development Alaska Legislative Audit & Budget Committee Alaska Senate Resources Committee June 17, 2004
2003 Earnings Inuvik International 13% Norman Wells Sponsored Investments 8% 40% Crude Oil Pipelines 27% Zama 13% Fort St. John Fort McMurray Gas Distribution Edmonton Gas Transmission Hardisty Regina Montreal Casper Toronto Buffalo Salt Lake City Chicago Toledo Patoka Wood River El Dorado Cushing Houston Enbridge Continental Assets • World’s longest crude oil pipeline system • Liquids deliveries > 2 million b/d • Assets > $13 billion • Stable “A” credit rating • Earnings of $667 million in 2003 • 10% of U.S. crude imports delivered by our system • Top 10% of industry in Safety Performance • All financial figures in Canadian Dollars Clearbrook Saint John Superior Ottawa Kansas City Liquids Transportation Gas Transmission 2 Gas Distribution
Enbridge Gas Business • 50% owner of Alliance Pipeline • In service December 2000 • 1857 miles (888 miles in the US / 969 miles in Canada ) • 36/42 inch diameter, high pressure, rich gas, 1.6 billion cubic feet/day • 21 month FERC regulatory process, 24 month NEB process • 42.7% interest in Aux Sable extraction & fractionation plant near Chicago • 60% owner & operator of Vector Pipeline • In service December 2000 • 348 miles (333 miles in the US / 15 miles in Canada) • 42 inch diameter, gas,1 billion cubic feet/day • 15 month FERC regulatory process • Canada’s largest natural gas distribution company • serving 1.7 million industrial, commercial and residential customers in Ontario, Quebec and New York State
Enbridge and Alaska Gas • Pursuing greenfield project through NEB/CEAA process • Only pipeline company with extensive experience in continuous and discontinuous permafrost construction & operations • Most recent cross-border, large diameter, high pressure, rich gas pipeline experience • Participated in both study & field trials in Alaska to examine state-of-practice of trenching in permafrost • Creative solutions to capital and operating risks • First company to negotiate incentive tolling agreement • Competitive connections to growing U.S. markets (gas and liquids) through Alliance, Vector and Enbridge Pipelines
Alaska Inuvik Gas Inuvik Norman Wells Norman Wells Pipeline Zama Substantial Northern Expertise Wellhead to Burner Tip: • Two natural gas wells • Production facility • 50 km (30 mile) buried pipeline and 44 km (27 mile) buried distribution system • Employees = 8 (75% aboriginal descent) • Joint Venture (1/3 ownership each) • Inuvialuit Petroleum Corporation • AltaGas Services • Enbridge Inc. • First buried pipeline in permafrost • Built in 1985 • Right-of-Way = 869 km (540 mi) • Employees = 17 • 19 years experience operating in permafrost
Demand Growth 1% per annum • Supply Growth • Alaska/Mackenzie • LNG and Unconventional • Supply Growth • Existing Basins • Deepwater Gulf Existing Well Supply Source: NPC Arctic Gas is Needed
Enbridge and Alaska Gas - Route Design Concept Parameters: • Initial and ultimate pipeline capacity • Cost and complexity of facilities • Number and location of compressor stations • Design specifications to meet expected conditions • Impact of optimizing gas & NGL composition • Timelines to meet market demand - measured approach
25 25 20 20 15 15 10 10 5 5 0 0 2002 2005 2008 2011 2014 Alberta Conventional Alberta CBM Sask BC MacKenzie Sable Canadian Supply (bcf/d)
Duke ANG Northern Border Alliance Ex-Western Canada Flows 2003 Average Ex-WCSB Flows Down 0.7 Bcf/d TCPL Source: Ziff Energy Group
Alliance Ex-Western Canada Contract Expiries Ex - Western Expiries MMcf/d 1600 1200 TCPL 800 Alliance Shippers have signed 15 year ship or pay transportation agreements that could expire in 2015. ANG 400 Northern Border 0 2004 2005 2006 2007 2008 2009 2010 2011 2012 2013 2014 2015 2016 Source: Ziff Energy Group
North American Gas Pipeline System Alaska Highway Gas Pipeline (proposed) TransCanada Alberta (NGTL) Westcoast ANG/ Foothills Alliance TransCanada Transmission Mainline Northwest Foothills M&NE TQ&M PGT Great Northwest PNGTS Lakes Northern Border Iroquois PG&E Kern River CNG Algonquin Trailblazer Vector ANR NGPL Panhandle Transwestern Texas Eastern ANR SoCal El Paso NGPL Transcontinental El Paso
Ex-Alberta Pipeline Capacity Outlook WCSB Supply / Demand / Exports* 2004: 16.8 bcf/d; 4.6 bcf/d; 12.2 bcf/d 2010: 19.3 bcf/d; 6.3 bcf/d; 13.0 bcf/d 2015: 24.9 bcf/d; 7.3 bcf/d; 17.6 bcf/d Alaska Highway Pipeline Pipeline Cap / Thruput 2004: n/a 2010: n/a 2015: 5.1 bcf/d; 5.1 bcf/d Spare ex-Alberta Pipe Capacity Max Cap / Thruput / Spare Cap 2004: 15.5 bcf/d; 12.2 bcf/d; 3.3 bcf/d 2010: 15.5 bcf/d; 13.0 bcf/d; 2.5 bcf/d 2015: 15.5 bcf/d; 17.6 bcf/d; -2.1bcf/d Duke (Westcoast) Pipeline Cap / Thruput 2004: 1.1 bcf/d; 0.9 bcf/d 2010: 1.1 bcf/d; 0.9 bcf/d 2015: 1.1 bcf/d; 1.1 bcf/d TransCanada Alberta Westcoast TCPL Mainline Pipeline Cap / Thruput 2004: 7.2 bcf/d; 5.2 bcf/d 2010: 7.2 bcf/d; 5.7 bcf/d 2015: 7.2 bcf/d; 7.2 bcf/d ANG/ Foothills Alliance ANG / Foothills / NWP Pipeline Cap / Thruput 2004: 2.8 bcf/d; 2.3 bcf/d 2010: 2.8 bcf/d; 2.5 bcf/d 2015: 2.8 bcf/d; 2.8 bcf/d TransCanada Transmission Mainline Northwest Foothills PGT Great Lakes Northern Border PG&E Alliance Pipeline Cap / Thruput 2004: 1.9 bcf/d; 1.7 bcf/d 2010: 1.9 bcf/d; 1.7 bcf/d 2015: 1.9 bcf/d; 1.9 bcf/d Northwest Vector Foothills / Northern Border Pipeline Cap / Thruput 2004: 2.4 bcf/d; 2.0 bcf/d 2010: 2.4 bcf/d; 2.1 bcf/d 2015: 2.4 bcf/d; 2.4 bcf/d * WCSB Supply Figures include 1.3 bcf/d (2010) and 1.5 bcf/d (2015) in supply from Mackenzie and 5.1 bcf/d (2015) supply from Alaska
Ex-Alberta Pipeline Capacity Outlook – Key Points • Alberta should have sufficient excess pipeline capacity to handle Alaska Gas via a phased approach – expect approx. 2.5 bcf/d of spare capacity through 2012-2015 • More excess capacity expected to become available after 2015 as WCSB supply declines (full 5 bcf/d by 2018-2020) • Alliance can add approx. 0.5 bcf/d of cheap capacity from new compression – will also lower tolls and improve netbacks into Chicago • Actual throughput vs. contracted throughput on GTNW (PGT) significantly lower – could provide additional availability to support growing California demand • Alaska Gas should help lower ex-Alberta tolls
Ex-Alberta Pipeline Tolls from Plantgate to Markets TransCanada Alberta Westcoast * Current snapshot. Representative tolls based on average firm service receipt (FSR) ANG/ Foothills Alliance TransCanada Transmission Mainline Northwest Foothills Stanfield PGT Great Malin Lakes Northern Border PG&E Dawn Vector Northwest Chicago
Ex-Alberta Pipeline Historical Differentials and Forwards TransCanada Alberta Westcoast ANG/ Foothills Alliance TransCanada Transmission Mainline Northwest Foothills Stanfield PGT Great Malin Lakes Northern Border PG&E Dawn Vector Northwest Chicago
Alaska NGL Considerations • Natural Gas Liquids historically command premium over commercial gas – natural hedge against lower gas netbacks • NGL processing must be considered in overall routing strategy to optimize costs and netbacks • Alaska Producers all have major midstream / petrochemical interests served by reliable & affordable gas supply • Alberta facing ethane shortage to feed existing petrochemical infrastructure • Alberta possesses significant excess plant & pipeline capacity • Cochin, Alliance and Enbridge Mainline deliver NGLs out of Alberta to US Midwest, Ontario and Quebec
Conclusions • Enbridge increasing its presence in Alaska • Filed application under Stranded Gas Act • Pursuing a greenfield alternative from Alaska to Alberta • Maximize returns for State and Producers through optimal market delivery options • Alliance and Vector Pipelines experience • Northern / Arctic experience - buried pipelines in permafrost • Alignment of key stakeholders • Continental solutions