Download
1 / 31
310 likes | 476 Vues
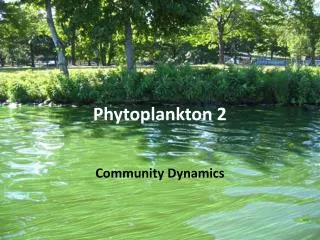
Chlorophyll and phytoplankton community changes in a shifting CO 2 environment. Natsuko Porcino University of Washington, Friday Harbor Labs Spring 2013. What are phytoplankton?. Microscopic photosynthetic organisms. The primary producers of the ocean.

E N D
Chlorophyll and phytoplankton community changes in a shifting CO2 environment Natsuko Porcino University of Washington, Friday Harbor Labs Spring 2013
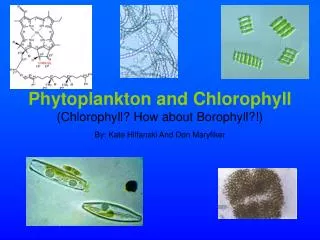
What are phytoplankton? • Microscopic photosynthetic organisms • The primary producers of the ocean • Account for half of all photosynthetic activity on Earth Photo courtesy of Amy Stephens
Cyanobacteria (0.5 – 2 microns) Nanoplankton (2 – 5 microns) Large phytoplankton (5+ microns)
CHLOROPHYLL • Used by primary producers to photosynthesize • A fluorophore
Were chlorophyll a levels different between the treatments? What populations were present? Were they different between CO2 levels?
High and drift: p<0.001 Control and high: p<0.001 Control and drift: p=0.728 (Friedman Rank Sum Test)
Control: rho=0.95, p<2.2x10⁻¹⁶ High: rho=0.93, p=1.3x10⁻¹⁴ Drift: rho=0.93, p=7.9x10⁻¹⁵ (Spearman Rank Correlation) T0 T2 T4 T6 T8 T10 T12 T14 T16 T18 T20
Were chlorophyll a levels different between the treatments? What populations were present? Were they different between CO2 levels?
Flow cytometry light emits light fluorophore fluorophore
FCM diagram courtesy of MUSC Department of Regenerative Medicine and Cell Biology
FL2-H (phycoerithrin, phycocyanin) FL3-H (chlorophyll) SSC-H (complexity) FSC-H (size)
Cyanobacteria (0.5 – 2 microns) Nanoplankton (2 – 5 microns) Large phytoplankton (5+ microns)
Control (bag 1) High (bag 2) Drift (bag 3) Day 2 Day 14 Day 21
Control and drift: p=0.001 Control and high: p=0.02 Drift and high: p=0.35 (Kruskal-Willis Test)
Control and drift: p=0.003 Control and high: p<0.001 Drift and high: p=0.003 (Kruskal-Willis Test)
Chi-squared: 1.35 p=0.51 (Kruskal-Willis Test)
T2 T6 T12 T13 T14 T15 T16 T17 T18 T19 T20 T21 T2 T6 T12 T13 T14 T15 T16 T17 T18 T19 T20 T21 T2 T6 T12 T13 T14 T15 T16 T17 T18 T19 T20 T21 Blue = small phytoplankton (<2 microns) Red = nanoplankton (2-5 microns) Green = large phyoplankton (>5 microns)
Conclusion • Distinct phytoplankton size classes present
Conclusion • Distinct phytoplankton size classes present • Shifts in population through time
Conclusion • Distinct phytoplankton size classes present • Shifts in population through time • Increasing number of large phytoplankton as the experiment progresses
Acknowledgements James Murray Kelsey Gaessner Robin KodnerMike Foy Ocean Acidification Research Apprentices Friday Harbor Labs Shannon Point Marine Center UW Department of Biology Educational Foundation of AmericaNational Science Foundation