Download
1 / 17
180 likes | 309 Vues
Fluxes and Change Detection in Nutrients, Chlorophyll, Phytoplankton Composition and Primary Production. Sang H. Lee, Terry E. Whitledge and Michael Kong Dept. of Oceanographic Science, University of Busan Institute of Marine Science, University of Alaska. RUSALCA PI Meeting

E N D
Fluxes and Change Detection in Nutrients, Chlorophyll, Phytoplankton Composition and Primary Production Sang H. Lee, Terry E. Whitledge and Michael Kong Dept. of Oceanographic Science, University of Busan Institute of Marine Science, University of Alaska RUSALCA PI Meeting Kotor, Montenegro 9-12 October 2010
2009 RUSALCA Hydrographic Sampling Stations
Primary Production Stations on Leg 2 GD7 HC49 WN3 HC24 WN1 SS4 HC60 SS5 LS3 CEN4 LS1 CL3 CL1 CL6 CL7A CS12 CS16 CS4 CS8 CS1
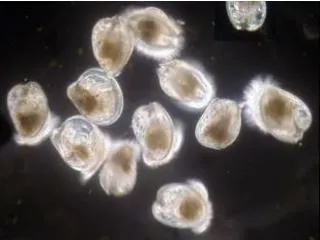
A>20 µm 5 µm <B<20 µm 32.5 psu 0.7 µm <C<5 µm 32.5 32.5 psu 31.8 psu C (3 %) B (3 %) A (94 %) A (42 %) B (18 %) C (40 %) Two different size communities of phytoplankton Lee et al. (2007) • Depending on different water masses, there were two different communities • of phytoplankton in the Chukchi Sea in 2004
Compositions of small phytoplankton (<20 μm) Synechococcus 8.8% GD7 Prochlorococcus 21.4% Pico and Nano 69.8% HC49 WN3 HC24 WN1 SS4 HC60 SS5 Synechococcus 18.6% LS3 CEN4 LS1 CL3 Prochlorococcus CL1 CL6 Pico and Nano 14.5% CL7A CS12 CS16 66.9% CS4 CS8 CS1 In 2009, synechococcus and prochlorococcus species were found among small phytoplankton communities (<20um) in our study sites. These species were limited in the Arctic cold waters. But, recently water temperatures in the Chukchi Sea (next slide) have increased up to 5 C in this region. So, these species could survive !
Warming Waters in the Chukchi Sea AMAP 2009, Blue line: minimum sea ice extent ~5 o C ↑
Macromolecular compositions of phytoplankton (averaged from 3 water depths, 100, 30, and 1% at each station) Proteins Polysaccharides Lipids LMWM PHL12 ST14 A3 ST10 BSL3 High protein production Low nitrogen stress? Lee et al. (2009) • In general, phytoplankton produced more proteins than other macromolecular compositions such as lipids, • Polysaccharides, and LMWM, which indicates that phytoplankton might not have a nitrogen limitation in the Chukchi • Sea. This is an interesting result since phytoplankton especially in the Alaskan Costal Water were characterized • as having nitrogen limitation before.
Light or Nutrients Limitations of phytoplankton • So, to try to find out which factor is more important for phytoplankton growth, enrichment experiments for light, • nitrate, and ammonium were performed in 20009. Good PI curves from light enrichment experiments were obtained at • every station, but not for nutrient enrichments. These results suggest light is a more important limiting factor for their • growth at least in the 2009 cruise.
25 mg C m-2 h-1 st20 31.8 . a2 nbs 12 2004 carbon uptake rates in the Chukchi Sea Average± S.D.: 36.8±41.4mg C m-2 h-1 st89 st73B . 32.5 st107 st106 ccl 15 32.5 32.5 . st24 phl 12 st14 st27 st11 a3 st10 32.5 Lee et al. (2007) • From the first Rusalca cruise in 2004, we got an average carbon uptake rate about 36.8 mg C m-2 h-1 in the Chukchi • Sea!
Primary Productivity Source Productivity Method Place or Water mass Season (g C m-2 day-1) McRoy et al. (1972) 4.1 14C uptake western Being Strait June Hameedi (1978) 0.1-1.014C uptake Chukchi Sea July > 3.0 central Chukchi Sea Sambrotto et al. (1984) 2.7 NO3- disappearance western Being Strait Springer (1988) 1.5-16 14C uptake central Chukchi Sea 11 July-2 August Korsak (1992)1.7 14C uptake Chukchi Sea 28 July-31 August Zeeman (1992) 1.614C uptake Chukchi Sea 28 July-31 August 0.8 Bering Strait Hansell et al. (1993) 4.8- 6.0 NO3- disappearance Anadyr Water in the north of Bering Strait Springer and McRoy 4.7 14C uptake and central Chukchi Sea 28 July-31 August (1993) chl-a concentration Hill and Cota (2005) 0.8 14C uptake northeastern Chukchi Sea summer Lee et al. (2007) 0.613C uptake Chukchi Sea 10-22 August 1.4 central Chukchi Sea • The 2004 primary production rates were 2 or 3 times lower than previous results in the Chukchi Sea! But, we were not • certain whether this lower productivity came from seasonal and annual variations. So, we measured more PP from other • international cruises.
100 C16 80 C14 60 C29 40 Chukchi Sea Russia 20 C26 C22 C09 Alaska 0 B26 B42 Bering Sea B21 B14 B10 2007 carbon uptake rates in the Chukchi Sea Average± S.D.: 35.8±45.2mg C m-2 h-1 mg C m-2 h-1 C04 RC03 B40 B04 • From 2007 Oshoro Maru cruise (early August), we measured an almost identical average rate in the Chukchi Sea • although the stations occupied were only on the US side.
2008 carbon uptake rates in the Chukchi Sea 50 Unit: mg C m-2 h-1 Average± S.D.: 44.9±62.2mg C m-2 h-1 R17 B11 R13 C15 C17 R09A C25 R07 R03 • From 2008 Xuelong cruise (early-mid August), a slightly higher rate was obtained but within the same range.
2009 rates in the Russian Chukchi Sea 20 10 0 Average± S.D.: 16.3±15.7mg C m-2 h-1 mg C m-2 h-1 HC49 WN3 HC24 WN1 SS4 SS5 HC60 LS3 LS1 CEN4 CL6 CS12 CL7A CS8 CS4 CS1 BS2 BS8 • In 2009 last year (Sept), the average rate was a much lower value than others. This might be due to a seasonal variation • since phytoplankton normally have a lower productivity in September in the Chukchi Sea. But, from satellite images (SeaWifs), • Chlorophyll-a conc and estimated PP in the Chukchi Sea in 2009 was significantly lower than other years (next slides).
Seasonal/Interannual Variations of PP 2003 2005 2004 2008 2009 2002 2006 2007 June July Aug Sept
Conclusions. Nutrients – ambient concentrations have decreased by 30-50% Phytoplankton – smaller size classes appear to have increased Chlorophyll – integrated biomass decreased by 40% Primary Production – rates are reduced 2-3 fold since 1980’s