Download
1 / 19
190 likes | 261 Vues
Precision Agriculture in Environmental Sustainability Rachel Crocker. Environmental Sustainability Index (ESI).

E N D
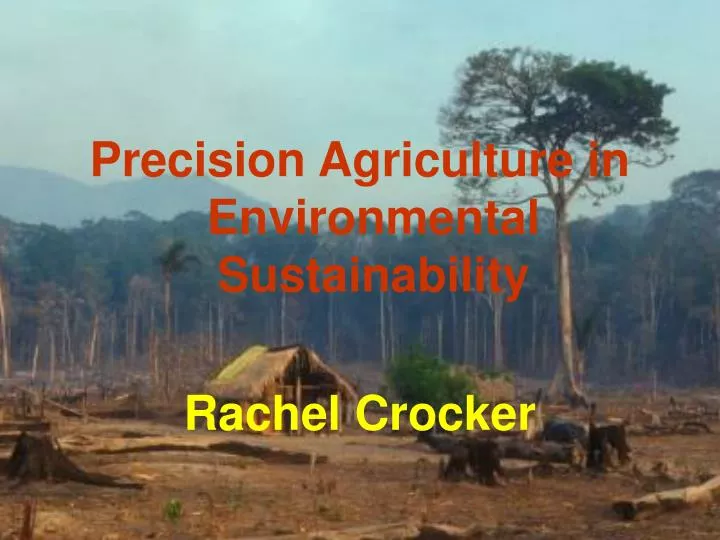
Precision Agriculture in Environmental Sustainability Rachel Crocker
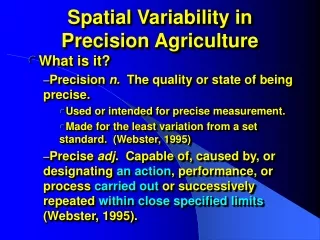
Environmental Sustainability Index(ESI) • Is a composite index tracking 21 elements of environmental sustainability covering natural resource endowments, past and present pollution levels, environmental management efforts, contributions to protection of the global commons, and a society's capacity to improve its environmental performance over time.
Environmental Elements • Natural resources- Trees • Pollution levels- fires • Environmental management efforts- Precision Agriculture • A society's capacity to improve its environmental performance over time- Brazil with Precision Agriculture. • Deforestation
Why • Roads • Mining • Cattle • Crops • Dams
Problems • Climate Changes • Soil erosion • Avalanches • Land slides
Where • Temperate and tropical • Brazilian Amazon 5 million sq.km • Rwanda • Tropical Africa • Southeast Asia • South America
How do we manage deforestation • Harmful so need to find a solution • Current solutions are not effective • Solution with Precision Agriculture • Satellite imagery • MODIS • DMC
MODIS • Moderate Resolution Imaging Spectroradiometer (MODIS) • Launched by NASA in 1999 (Terra) • Launched into orbit by NASA in 2002 (Aqua) • Aboard Terra and Aqua satellites to collect data from high resolution Landsat satellites. • Images the earth every one to two days • Lag between collection of data to availability of data is just a few days • Information became available in February 2000 (Terra) July 2002 (Aqua)
MODIS visibility • Bands from 400nm to 2100 • Total of 36 spectral bands http://nsidc.org/data/docs/daac/modis_v5/spectral_bands.html • Resolution from 250m to 1000m • Helps see the impact of human and natural activities effect on the environment
MODIS Limitations • Can not see when clouds are present • MODIS products come with cloud masks built in, to keep clouds from being interpreted as something else (snow). • Visible bands can only be used during the day. • Thermal bands are used day and night • Very coarse image
DMC International Imaging Ltd. • Disaster Monitoring Constellation • Processed and collaborated according to the customers needs • Used in an array of commercial and government applications • Rapid revisit times and wide area coverage drastically reduces the impact of cloud cover. • Daily revisit
DMC continued • Two satellites will be launched in October 2008 for Spain • In 2009 another will be launched for Nigeria • Isprovided by five satellite Constellation
DMC Visibility • Resolution at 32 meter • Bands of NIR, Red, and Green • Focuses on achieving a full coverage in short imaging windows to achieve homogeneity of data for analysis.
Future of deforestation Director General of The Brazilian National Institute for Space Research in Brazil says: • “The DMC data is an important affordable contribution to our assessment of the Amazon rainforest.” • “The constellation is able to rapidly acquire and deliver high quality imagery so that we have up to date information to focus our efforts. It is our intention to develop a long term relationship with DMC”
Implementation • The Brazilian National Institute for Space Research (INPE) • Three years DMC • Reduced deforestation from 27,000 sq.km. per year to about 10,000 sq.km. in 2007.
References • http://ieeexplore.ieee.org/iel5/9116/28908/01303972.pdf • NASA Satellite Data Provides Rapid Analysis of Amazon Deforestation Web Stie: http://www.sciencedaily.com/releases/2 005/09/050914105508.htm • Writers, S. (2008). DMCii Satellite Imaging Helps Dramatically Reduce Deforestation of Amazon Basin. Web site: http://www.spacemart.com/reports/DMCii_Satellite_Imaging_Helps_Dramatically_Reduce_Deforestation_of_Amazon_Basin_999.html • http://www.dmcii.com/applications/rp_a.htm
References • http://www.nside.org/data/modis/faq.html • http://ieeexplore.ieee.org/iel5/9436/29948/01370436.pdf?arnumber=1370436 • Saving Lives by Preserving Forests Around the World! Sun Ovens http://www.sunoven.com/saving%20lives.asp?OVRAW=modis%20deforestation&OVKEY=deforestation&OVMTC=advanced&OVADID=1574514021&OVKWID=14736066521 • MODIS Spectral Bands http://nsidc.org/data/docs/daac/modis_v5/spectral_bands.html