Download
1 / 46
540 likes | 1.02k Vues
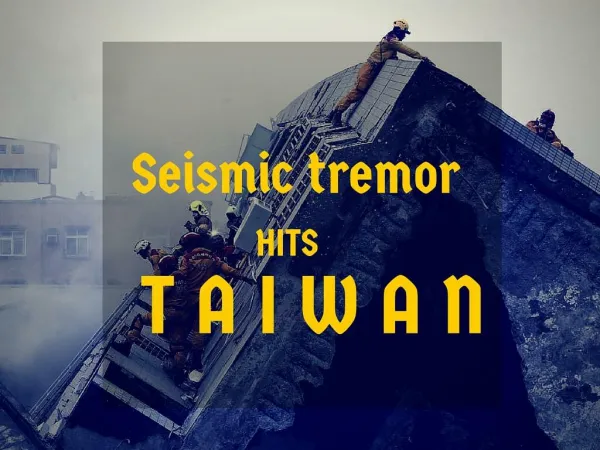
Micro-tremor Analysis in Seismic Reflection Data for Identification of Oil and Gas Reservoirs. ® . Tatiana Chichinina , tichqvoa@yahoo.com Instituto Mexicano del Petróleo (IMP ) Eugeny Hogoev IPGG Russian Academy of Sciences Alfonso Reyes-Pimentel UNAM .

E N D
Micro-tremor Analysis in Seismic Reflection Data for Identification of Oil and Gas Reservoirs ® • Tatiana Chichinina ,tichqvoa@yahoo.com • InstitutoMexicano del Petróleo(IMP) • EugenyHogoev • IPGG Russian Academy of Sciences • Alfonso Reyes-Pimentel • UNAM EAGE – Amsterdam – 19 of June 2014
The method is based on the phenomenon of natural seismic emission associated with Micro-Tremors of Hydrocarbon reservoirs in the subsurface of the Earth. This Hydrocarbon Microtremor is also called by Lambert et al. (2013 ) as “Ambient Wavefield Modification caused by a Hydrocarbon reservoir”. Lambert M.-A., Saenger E.H., Quintal B., and Schmalholz S.M., 2013, Numerical simulation of ambient seismic wavefield modification caused by pore-fluid effects in an oil reservoir, GEOPHYSICS, 78, T41–T52. EAGE – Amsterdam – 19 of June 2014
Method. • Frequency band of micro-tremors. • Updated Method • with application to field data. • Physical reasons of micro-tremors . EAGE – Amsterdam – 19 of June 2014
Method • Frequency band of micro-tremors. • Updated Method • with application to field data. • Physical reasons of micro-tremors . EAGE – Amsterdam – 19 of June 2014
The advantage of the method (proposed by Vedernikov, 2001) is that the input data for the analysis can be extracted from the conventional seismic reflection data. Thus, the method is of easy field-data acquisition compared to other passive seismic methods. EAGE – Amsterdam – 19 of June 2014
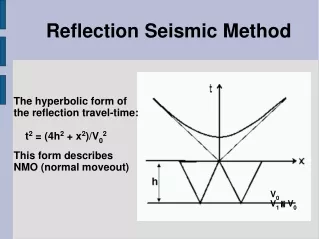
Long offsets and early times • The methodology consists of the use of raw seismic records at early times and far offsets. • These portions of the seismic traces contain information prior to the arrival of the waves generated by artificial source. 6 Additional part of seismogram used for the analysis of micro -tremors EAGE – Amsterdam – 19 of June 2014
Spectral analysis of micro-tremors linked to the presence of hydrocarbons [10 Hz ; 20 Hz] The end result is spectral amplitude values of micro-tremors for different frequency ranges shown along the seismic line, that is to say depending on the position of the receiver. You can note that the maximum intensity of the amplitude spectrum is observed in in the frequency interval from 10 Hz to 20 Hz. Bh1 EAGE – Amsterdam – 19 of June 2014
Method • Frequency band of micro-tremors • Updated Method • with application to field data • Physical reasons of micro-tremors EAGE – Amsterdam – 19 of June 2014
In other methods of Hydrocarbon Microtremor Analysis (HyMA), It has been observed that natural micro-tremor response in areas of oil and gas reservoirs exhibit certain characteristic behavior, with the maximum amplitude-spectrum energy at lower frequencies, in the interval from 1.5 Hz to 6 Hz. This frequency range of the Micro-Tremors is the same for different oil-gas fields . Note that in those methods there are no any sources used for excitation of artificial waves such as reflected waves in our case. In our method, which we present here, we use conventional seismic data, which is reflected waves originated from the excitation by artificial sources such as vibrators or explosions. That is why the frequencies of Micro-Tremors are lifted up to 20 Hz comparing with the frequencies in the methods of Passive Seismic Exploration. EAGE – Amsterdam – 19 of June 2014
Dangel et al. (2003) Journal of Volcanology and Geothermal Research State of the art In different (other) methods of analysis of the Hydrocarbon Micro-Tremors (HMT), the HMT frequency band is from 1.5 Hz to 4 Hz Se ha observado la prevalencia de ciertas frecuencias en los espectros de microsismos debido a la presencia de hidrocarburos. United Arab Emirates (UAE) Switzerland UAE The HMT frequency band is from 1.5 Hz to 4 Hz EAGE – Amsterdam – 19 of June 2014 10
Saengeret al., 2009 Case Study in México, Burgos gas/oil field No hydrocarbons Hydrocarbons The frequency band is from 1.5 Hz to 5 Hz • SaengerE.H., SchmalholzS.M., LambertM.-A., NguyenT.T., Torres A., Metzger S., HabigerR.M., Müller T., Rentsch S. and Méndez-Hernández E., 2009, A passive seismic survey over a gas field: Analysis of low-frequency anomalies. Geophysics, 74, p. O29-O40. 11
Holzner, et al., 2005, 2006 Natural micro-tremor spectral response of oil and gas reservoir Hydrocarbon Microtremor Analysis (HyMAS) The ever-present seismic background noise of the earth acts as the driving force for the generation of hydrocarbon indicating signals. The seismic background noise spectrum is modified in a different way when interacting with geological structures containing hydrocarbon filled pores compared with interaction with similar structures not containing hydrocarbons . EAGE – Amsterdam – 19 of June 2014 12
In the method presented here, the micro-tremor anomalies lie in the frequency range from 0 Hz to 20 Hz. Processing flow of the Analysis of the spectrums of micro-tremors: • Selection of the appropriate portions of traces from CRP gathers, • Application of rejection criteria for removing noisy records, • Implementation of Fast Fourier Transform, • Estimation of mean value of Amplitude Spectra in each frequency range, in function of the position of the receiver, • --with the subsequent amplitude smoothing, as it shown here: before smoothing and after.. Before smoothing After smoothing [0; 20 Hz] EAGE – Amsterdam – 19 of June 2014
Microtremors after excitation with a seismic vibrator Serdyukov and Kurlenya (2007) Hydrocarbon-microtremors’ frequenciesafterexcitation byseismicvibrator Amplitude spectrum From 11 Hz to 16 Hz Frequency from 22 Hz to 30 Hz Serdyukov S.V., Kurlenya M.V., 2007, Seismic stimulation of oil reservoirs // Russian Geology and Geophysics. v. 48, №11, p. 959-966. [in Russian]. 14
After stimulationwith vibrator, not only the frequency growth is observed, but also the intensity of hydrocarbon micro-tremors’ emission. Hydrocarbon microtremors’ amplitudes: before and after excitation with vibrator 5 minutes after excitation Beforeexcitation Amplitude spectrum Receiver coordinate along seismic line [m] Vedernikov et al. 2001 EAGE – Amsterdam – 19 of June 2014
Vedernikov et al. 2001 Stimulation experiment of hydrocarbon microtremors with vibrators Beforeexcitation 5 minutes afterexcitation Vedernikov G.V., Zharkov A.V., Maksimov L.A., 2001, Results on the analysis of the Earth hydrocarbon tremors: Geofizika. Special issue on 30 years of “Sibneftegeofizika”, p.96-98 [in Russian]. 16
Vedernikov et al. 2001 Stimulation of hydrocarbon micro-tremors after vibrator (vibro-seisms) excitation 17 Vedernikov G.V., Zharkov A.V., Maksimov L.A., 2001, Results on the analysis of the Earth hydrocarbon tremors: Geofizika. Specialissueon 30 years of “Sibneftegeofizika”, p.96-98 [in Russian].
Method • Frequency band of micro-tremors • Updated method • with its application to field data • Physical reasons of micro-tremors EAGE – Amsterdam – 19 of June 2014
Long offsets and early times The new approach: Long offsets and late times Additional part of seismogram is used for the analysis of micro-tremors EAGE – Amsterdam – 19 of June 2014 19
To improve the method, we propose using the late-time portion of seismic traces, additionally to the earliest-time portion. • We consider that in the seismic records at large times of arrival (that is several seconds , for example 3.5 sec in this case), the artificial-wave energy has been attenuated to such a degree that the dominant response provides us pure natural micro-seismic response. This enables us separating natural hydrocarbon micro tremors from reflected waves… EAGE – Amsterdam – 19 of June 2014
Comparison The new approach Input data: The earliest-time portions of seismic traces Input data: The late-time portions of seismic traces EAGE – Amsterdam – 19 of June 2014 21
Amplitude-spectrum map of micro- tremors Spectrum • Well Bh-1 Zoomed fragment (b). • Pair of intersected seismic profiles (W-E and N-S) EAGE – Amsterdam – 19 of June 2014
Method • Frequency band of micro-tremors • Updated Method • with application to field data • Physical reasons of micro-tremors EAGE – Amsterdam – 19 of June 2014
Why hydrocarbon reservoirs have the micro-tremor-emission spectrum of low frequency? What is the physical reason of it? EAGE – Amsterdam – 19 of June 2014
Why the micro-fractures saturated with oil or gas cause the low-frequency micro-tremors’ emission ? And water-saturated fractures do not cause it... Why?
There were performed numerous efforts to understand the causes of this phenomenon of microseisms related to oil and gas. Nowadays there is no unique theory which perfectly explains all the aspects of this phenomenon. However in spite of absence of a unified theory, various methods of MicroTremorspectral analysis are rapidly developed for seismic exploration of oil and gas. The ever-present seismic background noise of the earth acts as the driving force for the generation of hydrocarbon indicating signals. The seismic background noise spectrum is modified in a different way when interacting with geological structures containing hydrocarbon filled pores compared with interaction with similar structures not containing hydrocarbons . EAGE – Amsterdam – 19 of June 2014
Current investigations which combine the macroscopic aspects of Krauklis wave* propagation, as well as the microscopicporo-mechanical amplification mechanism, are expected to provide major steps towards the complete understanding of the occurrence of Hydrocarbon Microtremorsignals (Holzner et al, 2005). • ------------------------------------------------------------------------------------------------- • (*) Korneev (2008, 2010, 2011), Korneev et al (2004, 2009, 2012) • onKrauklis wave . • R. Holzner, P. Eschle, H. Zürcher, M. Lambert, R. Graf, • S. Dangel and P.F. Meier, 2005, • Applying microtremor analysis to identify hydrocarbon reservoirsFirst Break, V. 23, No 5, May 2005 EAGE – Amsterdam – 19 of June 2014
Lambert et al. (2013) consider a possible mechanism causing Hydrocarbon Microtremor signals, which can be understood within the framework of a poro-mechanical amplification mechanism driven by the ever present seismic background noise that resonantly enhances low frequency seismic signals due to the interaction of liquid hydrocarbons, and pore-rock material. The resulting oscillations are transmitted from the reservoir to the surface almost without attenuation or scattering losses due to the low frequency. Lambert M.-A., Saenger E.H., Quintal B., and Schmalholz S.M., 2013, Numerical simulation of ambient seismic wavefield modification caused by pore-fluid effects in an oil reservoir, GEOPHYSICS, 78, T41–T52. EAGE – Amsterdam – 19 of June 2014
Following Lambert et al (2013), poroelastic effects within an oil reservoir may be a plausible explanation for low-frequency ambient wavefield modifications observed at oil fields. Wave-induced fluid flow at the mesoscopic scale in an oil reservoir is a physical mechanism that can cause significant attenuation contrast to the surrounding rocks. As a physical consequence of this model, ambient wavefield modifications are generated by the reservoir. Above the oil-saturated reservoir EAGE – Amsterdam – 19 of June 2014
Acoustic emission after stimulation by ultrasonic excitation in oil saturated rock and water- saturated rock Kuznetsov , Dyblenko, Chirkin et al. 2007 Water Oil Kuznetsov O.L. , Dyblenko V.P. , Chirkin I.A. et al , 2007, Specific features of geomechanical-stress accumulation and anomalous seismic-acoustic emission in oil and gas-saturated rocks : Geofizika, 6, 8-15 33
Acoustic emission stimulated by ultrasonic pulses Kuznetsov , Dyblenko, Chirkin et al 2007 Stimulation by ultrasonic wave pulses E Oil-saturatedrocks III I 10 II Watersarurarted rocks Application of mechanical loading 8 6 Energy Dryrocks 4 After stimulation 2 0 t [s] 0 20 40 60 80 100 Time 34
Dr. IrekFayzullinhypothesizes that the primary mechanism of hydrocarbon micro-tremor (HMT) is the “in-situ” effect of "disclosure-closing" of microcracks in the subsurface of the earth. The potential elastic energy of the micro-tremor emission is accumulated at the ends of each crack in the form of stress anomalies. Through this mechanism, the potential energy is transformed into kinetic energy, i.e.–into the micro-tremor emission; the maximum energy is released at the moment of crack closing. Every day, some of fractures are "active ", i.e. they are closing and disclosing to the state of unstable equilibrium. (*) Fayzullin I.S. , Kutsenko N.V. , 2004, The feasibility of using the scattered waves for the study of fractured geomedium. Numerical simulation:Geofizika, № 5, p.5-9. D'yakonov B.P., I.S. Fayzullin, 2009, Response of fractured (consisted of block units) media to seismic-acoustic excitations and/or natural microseisms. Part I. Evolution of cracks under variable manmade and natural loading: Geofizika, № 3, p. 5-11.
During the micro-fracures’ growth, these micro-fractures are opening, and then they are closing in the subsequet stage of rock compaction, and this can be the main cause of microtremors. (D'yakonov and Fayzullin, 2009) Micro-tremors occur due to the fractures´ growth with its subsequent decrease in growth and partial closing. Thus the increase and decrease of fractures´ growth takes place due to in-situ temporal stress variations . That is in-situ stress-induced rock compaction and de-compaction variations, which can be considered as the main cause of micro-tremors. Seismic monitoring of the open-fracture variation in reservoir rocks due to Linisolar Tides. Kouznetsov, Chirkin, et al 2006 (a)– horizontal section (b) – vertical section 36
Why the micro-fractures saturated with oil or gas cause the low-frequency micro-tremors’ emission ? And water-saturated fractures do not cause it... Why?
D'yakonovB.P., I.S. Fayzullin, 2009, Response of fractured (consisted of block units) media to seismic-acoustic excitations and/or natural microseisms. Part I. Evolution of cracks under variable manmade and natural loading: Geofizika, № 3, p. 5-11. The process of the microtremors´ (MT) emission occurs constantly in the subsurface and it never attenuates. It is differentiated in space and time by the average energy, variance and frequency of events of the MT emission . In turn, these statistics parameters are dominantly determined by such factors as dynamic state of stress, in-situ geo-mechanical properties and the type of saturation fluid (gas, water, or oil) in microfractures. The fluid type effects to the MT-emission frequency, which is different due to different magnitude of fluid-penetration rate, that is different penetration ability for filtrating into the cavity of closing crack for each fluid (e.g. oil or water). Presence of fluid results in acceleration of the process of disclosure of fracture and its transition into unstable state . A speed of penetration of fluid in crack is determined by the phase-permeability coefficient. The higher is the phase-permeability coefficient of fluid, the more frequent is the act of microtremors´ emissions, and so the higher MT-emission frequency is observed.
D'yakonovand Fayzullin, 2009 The coefficient of permeability of the fluid phase of water is larger than this coefficient of oil. And so the water opens and enters into the closed microcracks more quickly compared to the case of oil saturated cracks ... Therefore, the maximum of microtremors’ spectrum over oilfields shifts towards more lower frequencies compared to the frequencies over water-filled cracks. That is, in other words, the water-saturated cracks make the cycle of opening -closing and making claps (while doing this) more frequently, in comparison with the oil-filled cracks. That is in contrast with water-filled cracks, the oil-filled cracks will clap less frequently (rarely). This can explain why oil reservoirs have low-frequency anomalies of the microtremoremission of lower frequency than that of water-saturated cracks. http://ts.sbras.ru/ru/Pages/articles.aspx?Nomer=1_10
Back-scattered waves After stimulation (excitation) by a vibrator, the so-called “Back-Scattered” seismic waves (also called as “Diffracted” waves) are generated, which are originally caused by populations (ensembles) of open fractures. Special data-processing sequence (method SLBO) is developed, in which this type of wave is separated; these are back-scattered waves, which are related to the micro-tremor emission of hydrocarbons (also known as hydrocarbon microtremor (HM)). A technology SLBO is developed, which provides reliable 3D imaging of the fractures’ spatial distribution in subsurface, as well as direct hydrocarbon indicator; the latter is a new development (namely the method “СЛОНГ-SLONG”(*). Spectral attributes estimated from these micro-tremors are related to the direct hydrocarbon indicators. FayzullinI.S. , A.V. Seregin, A.V. Volkov, 2013, On the connection of the energy of the scattered waves to the physical characteristics of rocks. Seismic side-scanning method (SLBO): Geofizika, № 4.
Literature Fayzullin I.S., Chirkin I.A., 1998, Seismic-acoustic method for studying fractured rocks: Geoinformatika, № 3, p.24-27 . Fayzullin I.S., Kutsenko N.V., 2004, The feasibility of using the scattered waves for the study of fractured geomedium. Numerical simulation:Geofizika, № 5, p.5-9. D'yakonov B.P., I.S. Fayzullin, 2009, Response of fractured (consisted of block units) media to seismic-acoustic excitations and/or natural microseisms. Part I. Evolution of cracks under variable manmade and natural loading: Geofizika, № 3, p. 5-11. Fayzullin I.S., B.P. D'yakonov, R.S. Khisamov, R.KH. Muslimov, N.V. Kutsenko, 2006, On the impact of seismic-acoustic excitation on flooded oil reservoirs: Tekhnologiiseysmorazvedki, № 3. Fayzullin I.S., A.V. Seregin, A.V. Volkov, 2013, On the connection of the energy of the scattered waves to physical characteristics of rocks. Seismic side-scanning method (SLBO): Geofizika, № 4.
Resonance model of seismic waves between the ground surface and the oil reservoir Birialtsev et al., 2006 Shabalin et al. 2013 Spectrum Frequency Ground surface Resonance of low-frequency (long -wavelength) P waves Oil reservoir http://www.gradient-geo.com/m_phyisic.htm
Method of low frequency seismic surveys in oil and gas exploration Birialtsev E. V., Plotnikova I.N., Khabibulin I.R., Shabalin N.Y., 2006, The analysis of microseism spectrum for prospecting of oil reservoir in Republic Tatarstan, EAGE Conference, Saint Petersburg, Russia. Shabalin N.YA., Birialtsev E. V., Ryzhov V.YA., 2013, Passivemethods in low-frequencyseismicexploration– Myths and Realities . Priboryi sistemyrazvedochnoygeofiziki, 2 (44), p. 46-53. [in Russian].
Resonance model of seismic waves between the ground surface and the oil reservoir Birialtsev et al., 2006 Shabalin et al. 2013 OIL Note the difference in the case of the layer with water saturation Water
A mechanism of condensation and evaporation of oil- droplets on the surfaceof the micro-crack cavity and/or gas bubbles in fluid infill of crack is developed by Kuznetsov et al., 2003. Kuznetsov O.L., Grafov B.M., Suntsov A.E., and Arutyunov S.L., 2003, ANCHAR technology: the method background. Spetsialniyvypusk “Tehnologiiseysmorsvedki –II”, Geofizika, p. 103-107. EAGE – Amsterdam – 19 of June 2014
Schematic representation of a simple bi-conical pore geometry which enables low frequency oscillations of the contained liquid along z-direction Holzneret al., 2009, Communications in NonlinearScience and NumericalSimulation, 14, 160-173. 46
Rheological model for coupling between elastic deformation and fluid oscillations Frehner et al., 2009 Seismic waves propagation through solids exhibiting a resonance frequency. Modification of spectra 47
Glikmanhypothesis in the paper of Kulikov S.A., Gatiyatullin N.S., and Kulikova E.R What is the physical reason of Hydrocarbon Micro-Tremors? Capacitor oil -- May be electric resonant circuit formed by oil reservoir (the capacitor)? 48
Thank you ® tichqvoa@yahoo.com http://chichinina.rusiamexico.com EAGE – Amsterdam – 19 of June 2014 59