Download
1 / 10
100 likes | 105 Vues
Data Mining in Micro array Analysis. Classification (Supervised Learning) Finding models (functions) that describe and distinguish classes or concepts for future prediction E.g., predict disease based on gene expression profiles

E N D
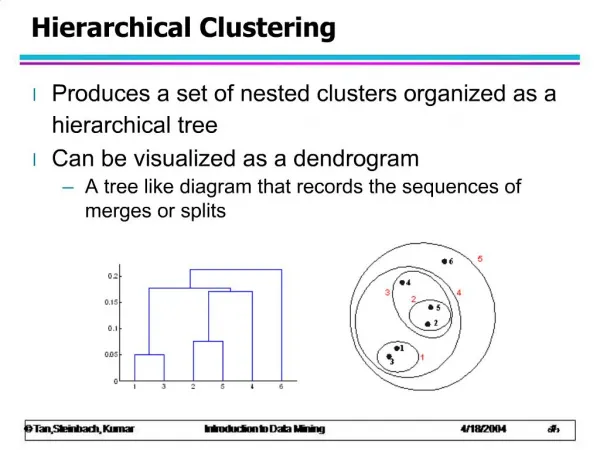
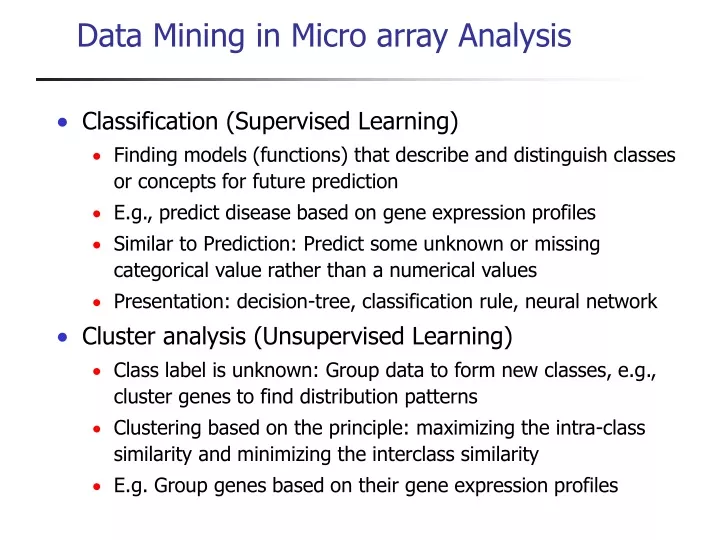
Data Mining in Micro array Analysis • Classification (Supervised Learning) • Finding models (functions) that describe and distinguish classes or concepts for future prediction • E.g., predict disease based on gene expression profiles • Similar to Prediction: Predict some unknown or missing categorical value rather than a numerical values • Presentation: decision-tree, classification rule, neural network • Cluster analysis (Unsupervised Learning) • Class label is unknown: Group data to form new classes, e.g., cluster genes to find distribution patterns • Clustering based on the principle: maximizing the intra-class similarity and minimizing the interclass similarity • E.g. Group genes based on their gene expression profiles
Supervised vs Unsupervised Learning Unsupervised Clustering Supervised Classification • unknown number of classes • known number of classes • based on a training set • no prior knowledge • used to classify future observations • used to understand (explore) data
debt * * o o * o * o o * o * * * * o o * o * o income debt debt * + * + o o + + * + o + * + o o + + * + o + * * + + * + * + o + o + * + o + * + o + income Supervised vs. Unsupervised Learning debt + + + + + + + + + + + + + + + + + + + + + Supervised Learning Unsupervised Learning income
Classification Training Set Data with known classes Data with unknown classes Class Assignment Classification Technique Classifier
debt * * o o * o * o o * o * * * * o o * o * o income debt * * o o * o * o o * o * * * * o o * o * o income Types of Classifiers Linear Classifier: Non Linear Classifier: debt * * o o * o * o o * o * * * * o o * o * o income a*income + b*debt < t => No loan !
Predictive Modelling: Day Outlook Temperature Humidity Wind Play Tennis 1 Sunny Hot High Weak No 2 Sunny Hot High Strong No 3 Overcast Hot High Weak Yes 4 Rain Mild High Weak Yes 5 Rain Cool Normal Weak Yes 6 Rain Cool Normal Strong No 7 Overcast Cool Normal Strong Yes 8 Sunny Mild High Weak No 9 Sunny Cool Normal Weak Yes 10 Rain Mild Normal Weak Yes 11 Sunny Mild Normal Strong Yes 12 Overcast Mild High Strong Yes 13 Overcast Hot Normal Weak Yes 14 Rain Mild High Strong No • Predict categorical class labels • Classify data (construct a model) based on the training set and the values (class labels) in a classifying attribute and • Use it in classifying new data
Task: determine which of a fixed set of classes an example belongs to Input: training set of examples annotated with class values. Output:induced hypotheses (model/concept description/classifiers) Classification Learning : Induce classifiers from training data Inductive Learning System Training Data: Classifiers (Derived Hypotheses) Predication : Using Hypothesis for Prediction: classifying any example described in the same manner Classifier Decision on class assignment Data to be classified
Outlook Sunny Overcast Rain Humidity Wind Yes Strong High Normal Weak No Yes No Yes Decision Tree: Example Day Outlook Temperature Humidity Wind Play Tennis 1 Sunny Hot High Weak No 2 Sunny Hot High Strong No 3 Overcast Hot High Weak Yes 4 Rain Mild High Weak Yes 5 Rain Cool Normal Weak Yes 6 Rain Cool Normal Strong No 7 Overcast Cool Normal Strong Yes 8 Sunny Mild High Weak No 9 Sunny Cool Normal Weak Yes 10 Rain Mild Normal Weak Yes 11 Sunny Mild Normal Strong Yes 12 Overcast Mild High Strong Yes 13 Overcast Hot Normal Weak Yes 14 Rain Mild High Strong No
Classification: Relevant Gene Identification • Goal: Identify subset of genes that distinguish between treatments, tissues, etc. • Method • Collect several samples grouped by treatments (e.g. Diseased vs. Healthy) • Use genes as “features” • Build a classifier to distinguish treatments
G1 <=22 >22 G3 G4 <=52 <=12 >12 >52 Yes No Yes No Gene Expression Example ID G1 G2 G3 G4 Cancer 1 11.12 1.34 1.97 11.0 No 2 12.34 2.01 1.22 11.1 No 3 13.11 1.34 1.34 2.0 Yes 4 13.34 11.11 1.38 2.23 Yes 5 14.11 13.10 1.06 2.44 Yes 6 11.34 14.21 1.07 1.23 No 7 21.01 12.32 1.97 1.34 Yes 8 66.11 33.3 1.97 1.34 Yes 9 33.11 44.1 1.96 11.23 Yes 10 11.54 11.1 1.97 10.01 Yes 11 12.00 15.1 1.98 9.01 Yes 12 15.23 1.11 1.89 12.48 No 13 31.22 2.0 1.99 13.51 Yes 14 11.33 11.1 1.01 11.01 No 15 ….. … .. .. .. Problem: With large number of genes (~10000) Need to use feature selection/reduction techniques