Download

1 / 68
680 likes | 783 Vues
Lake Sunapee Region Strategic Planning Initiative. Meeting Four: Presenting the Data (06.23.13). Lake Sunapee Region Community Wellness Task Force Current Members. Meeting Agenda. 1:00-1:15 - Agenda, Role Assign, Overview

E N D
Lake Sunapee Region Strategic Planning Initiative Meeting Four: Presenting the Data (06.23.13)
Lake Sunapee Region Community Wellness Task ForceCurrent Members
Meeting Agenda 1:00-1:15 - Agenda, Role Assign, Overview 1:15-2:00- Presenting the Data: Social Determinants of Health & Service Area Health Data 2:00-2:30 - New London Hospital Programs & Successes 2:30-2:50- Keene Summit Summary 2:50-3:00- Next steps and next meeting date (6/29 from 3 – 5pm at Lake Sunapee Bank)
Role Assignments Leader – Catherine Bardier Recorder – Lauren Conkey Timekeeper – Facilitator –
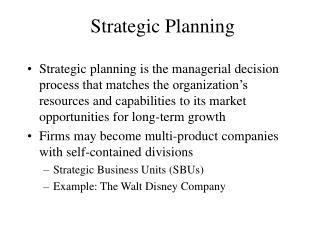
Process and Outcomes Forming a strong team Defining decision making process Clarifying our service area Studying landscape – who, what, where Drafting – Mission, Vision, Values, Goal One Developing action steps –”Employers as a vehicle for promoting community health and wellness” Collaborating with “Healthy Monadnock” and D-H
Strategic Questions to Think About • What is our formal name? • Is anyone missing at this table? • Who needs to be giving input to our first drafts? • How will we make decisions now and in the future? • What will our infrastructure look like? • What are the limits of collaborative planning? • How will we make our work sustainable? • How will we fund this community work? • Priorities – short term and long term? • What are our outcome and process (economic, health, funding) measures? • What data do we need? • How to build public involvement and buy-in (on-going)? • Communication strategy? • How to continuously refresh our plan? • What are our measures of success?
Timeline * Months with two meetings
Andover Bradford Croydon Danbury Goshen Grantham Lempster Newbury New London Newport Springfield Sunapee Sutton Warner Washington Wilmot Towns Serviced by NLH, Kearsarge and Newport School Districts: Anything missing?
New London Hospital Patient Visits* FY2008/2009 * Includes inpatient and selected outpatient procedures Source: Uniform Hospital Data Discharge Set (UHDDS)
Service Area Data: Demographics Highlighted towns have oldest median age
Determinants of Health Models Help Frame Data and Information
Service Area Data: Disease & Injury Highlighted outcomes indicate statistically significant difference
Service Area Data: Disease & Injury • Merrimack & Sullivan counties have statistically significant higher rates of premature death & substance abuse-related emergency hospital discharges than the state of NH • Sullivan county has a statistically significant higher rate of unintentional injury-related emergency hospital discharges than the state of NH
Health & Function Physical Functioning Mental Functioning Role Functioning Social Functioning
Individual Response - Behaviors • Intermediate determinant • Behaviors e.g., diet, exercise, drinking, smoking, drug use, coping, are seen as responses to other factors • Not voluntary acts amenable to direct intervention • Shaped by multiple forces: social and physical environments and genetics • Behavior change remains a goal • “Health Eating Active Living”
Service Area Data: Individual Behavior 62.6% 63.6% 63.0%
Service Area Data: Social Environment Lowest Income Highest Income
Service Area Data: Prosperity Least Affluent: Croydon, Danbury, Goshen, Lempster, Newport, Washington More affluent: Andover, Bradford, Grantham, New London, Newbury, Springfield, Sunapee, Sutton, Wilmot
Service Area Data: Prosperity Lower Income: Croydon, Danbury, Goshen, Lempster, Newport, Washington Higher Income: Andover, Bradford, Grantham, New London, Newbury, Springfield, Sunapee, Sutton, Wilmot