Download

1 / 17
170 likes | 281 Vues
A study on application of the distributed rainfall-runoff model in the Japanese Urban area. Taro Tateishi Recycling and Environmental Engineering Graduate School of Fukuoka University Kitakyuushuu, of Japan. Self-introduction. 2 nd grade of master course A bachelor: Mechanical Engineering

E N D
A study on application of the distributed rainfall-runoff model in the Japanese Urban area Taro Tateishi Recycling and Environmental Engineering Graduate School of Fukuoka University Kitakyuushuu, of Japan
Self-introduction • 2nd grade of master course • A bachelor: Mechanical Engineering • I will be the consultant of sewer collection system from next year.
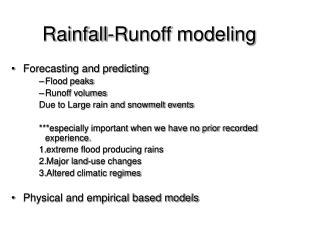
Combined Sewer Overflow (CSO) Inundation Eutrification of static area and so on The problems in urban catchment
In order to overcome these problems • It is essential to know the actual condition, but it’s hard to measure behavior of runoff generation with uncertainty event. The estimation by the distributed model is required
The present condition of Distributed model In Europe and United States, • The hydraulic modeling softwares for the sewer collection system have been fully developed. • The next topic is how to estimate the hydrographs from sub-catchments to these models.
The catchment of kurosaki area, kitakyushu-city fukuoka, Kyuushuu Island of Japan Catchment area :144(ha) This catchments area is consists of industry area in north, residential area in south, and commercial area at the center. The railroad is running across this catchment N Outline of the catchment as object modeling industrial area commercial are residential area 500m The road The pomp section Trunk pipeline Catchment boundary
Sewer system:combined sewer system The number of Manholes :922 Pipeline length:30,000(m ) The pomp station is located at the downstream end of sewer collection system. N Outline of sewer system 500m The pomp station Branch’s pipeline Trunk pipeline Boundary of catchment
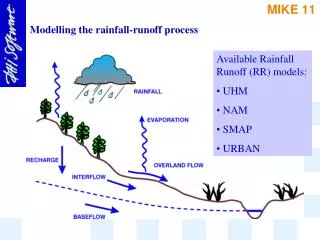
Structure of Urban catchment model 1.Network model (which calculates the process until rain water flows ground surface and it flows into a drain pipe network. ) (which calculates the behavior of the sewer in pipe network.) 2.Rainfall-runoff model
Runoff 1. Network model Assumption: • The catchment: The sub-catchment is the area of flowing to a mannhole. The stormwater is collected at the sub-catchment. • The network: The stormwater is discharged the sewer network. Sub-catchment pipeline manhole manhole pipeline flow
1-1. The catchment in this study • The whole catchment was divided into 600 sub-catchments for every manhole.(An average of 0.24 ha) 100m Expansion boundary of Catchment boundary of Sub-catchments manhole Pipeline (flow course)
1-2. The network Construction of sewer system based on map of sewer collecting the authorities by using InfoworksCS • The ground level of manholes • The length, width, type and invert level of pipes To construct sewer system, we inputted ・・・
Structure of Urban catchment model 1.Network model (which calculates the process until rain water flows ground surface and it flows into a drain pipe network. ) (which calculates the behavior of the sewer in pipe network.) 2.Rainfall-runoff model
2. Rainfall-runoff model Assumption ① Runoff is generated from the ratio of the “impervious area”. ② Land use classified 7 types. • Roof (slope), Roof (flat), Other impervious area, Road, Gravel area, Soil, Grassland
Classification of Surface conditions Land use pattern map • We classified 7 types of surface conditions by a field survey and a residence map. • Roof (slope) • Roof (flat) • Other impervious area • Road • Gravel area • Soil • Grassland 500m
Surface type distribution in whole catchment Grassland 13% Roof (slope)9% Soil 3% Gravel area 4% Roof (flat)22% Road 21% Other impervious area 28% Impervious area is 80%, pervious area is 20%
Sub-catchment Land use pattern map Roof (slope) Roof (flat) Other Impervious area Road soil grassland Gravel area Methodology– to calculate runoff ratio 1. Classification of Surface conditions 2. Division of the catchment Overlaying 3. Pick up the area ratio of land use for each sub- catchemnt Then, we calculate the runoff ratio for sub-catchments
For further investigation • I want to pick up problems through these works and propose the countermeasures. • Next, Concrete plan ★ Distribution of rainfall ★ Inundation analysis inundated area Modeling of load as conduit pipeline Figure; Image of inundation model