Download
1 / 12
160 likes | 322 Vues
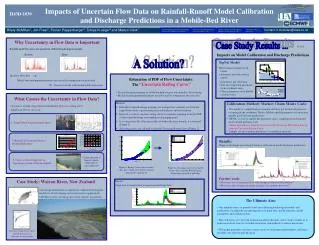
Data mining issues on improving the accuracy of the rainfall-runoff model for flood forecasting. Jia Liu Supervisor: Dr. Dawei Han Email: Jia.Liu@bristol.ac.uk WEMRC, Department of Civil Engineering University of Bristol 24 May 2010. Outlines.

E N D
Data mining issues on improving the accuracy of the rainfall-runoff model for flood forecasting Jia Liu Supervisor: Dr.Dawei Han Email: Jia.Liu@bristol.ac.uk WEMRC, Department of Civil Engineering University of Bristol 24 May 2010
Outlines • Introduction to the Probability Distributed Model (PDM) • Two data mining issues: • Selection of data for model calibration • Optimal data time interval in flood forecasting • Conclusions and Future work
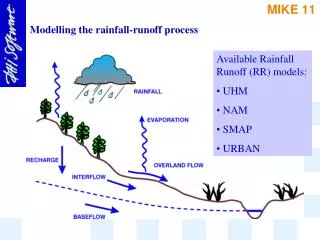
Rainfall (and Evaporation) Rainfall-Runoff Model Runoff Introduction to rainfall-runoff model Hydrological Cycle Rainfall-runoff model • A conceptual representation of the hydrological cycle • The fundamental work for any water researches, i.e., real-time flood forecasting, land-use change evaluations and design of hydraulic structures, etc.
Probability Distributed Model by Moore (1985) Introduction to rainfall-runoff model Hydrological Cycle 13 Model Parameters to be calibrated fc, Td, cmin, cmax, b, be, kg, bg, St, k1, k2, kb, qc Rainfall-runoff model • A conceptual representation of the hydrological cycle • The fundamental work for any water researches, i.e., real-time flood forecasting, land-use change evaluations and design of hydraulic structures, etc.
Data + Large quantity Fast sampling rate 1. How long the data should be? Data Length 2. Which period the data should be selected from? Data Duration Data Time Interval How to cope with the ‘data rich’ environment? Questions proposed: A. How to select the most appropriate data to calibrate the model? B. When used for forecasting, what is the most appropriate sampling rate?
A good information quality of the calibration data set = A similar information content to validation data set Calibration data selection: data length and duration • Data used for model validation is often determined. • We assume that the more similarity the calibration data bears to the validation data, the better performance the rainfall-runoff model should have after calibration. Comparison of the information quality of the two data sets Validation data set Calibration data set
Flow Duration Curve • Fast Fourier Transform • Discrete Wavelet Decomposition Calibration data selection: data length and duration • An index which can reveal the similarity between the calibration and validation data sets, can be used as a guide for calibration data selection for the rainfall-runoff model. • Information Cost Function (ICF) Energy of approximation Energy of detail Percentile energy on each decomposition level Liu, J., and D. Han (2010), Indices for calibration data selection of the rainfall-runoff model, Water Resour. Res., 46, W04512, doi:10.1029/2009WR008668. The Information Cost Function (ICF) is a an entropy-like function that gives a good estimate of the degree of disorder of a system
Too slow Too fast Leading to numerical problems [Åström, 1968;Ljung, 1989] Lower boundary: Short lead time Error Model error Data time interval Time interval Long lead time Error Z Forecast lead time Forecast lead time Data time interval Time interval ZN X Z1 XN Y YN X1 Y1 Optimal data time interval – for the forecast mode Sampling rate of model input data Sampling theory Optimal time interval Hypothetical curve A positive relation
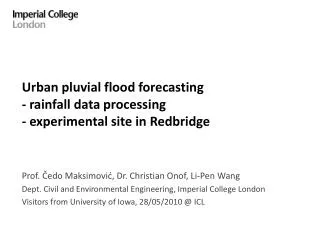
Bellever Halsewater 50°40′N 51°05′N 51°00′N 50°35′N 3°15′W 3°10′W 3°05′W 4°00′W 3°55′W 51°10′N 51°05′N 51°00′N 51°05′N Brue Bishop_Hull 2°35′W 2°30′W 2°25′W 3°20′W 3°15′W 3°10′W Optimal data time interval – for the forecast mode • Case study • Auto-Regressive Moving Average (ARMA) model for on-line updating • Four catchments are selected from the Southwest England: LDP: longest drainage path (km) DPSBAR: mean drainage path slope (m/km)
Bellever Halsewater Brue Bishop_Hull Optimal data time interval – for the forecast mode • Case study • The positive pattern between the optimal data time interval and the forecast lead time is found to be highly related to the catchment concentration time. LDP: longest drainage path (km) DPSBAR: mean drainage path slope (m/km)
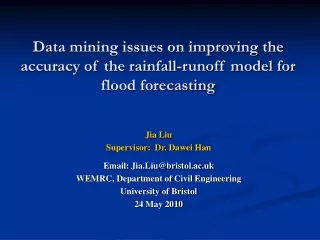
As real-time inputs Rainfall (and Evaporation) Updated by observations Rainfall-Runoff Model Runoff Conclusions and Future work • Selecting data with the most appropriate length, duration and time interval is of great significance in improving the model performance and helps to enhance the efficiency of data utilization in rainfall-runoff modelling and forecasting. • More research is needed to explore the applicability of the ICF index for calibration data selection and to verify the hypothetical curve of the optimal data time interval. Weather Research & Forecasting (WRF) Model
The End Thank you for your attention!