Download
1 / 28
280 likes | 496 Vues
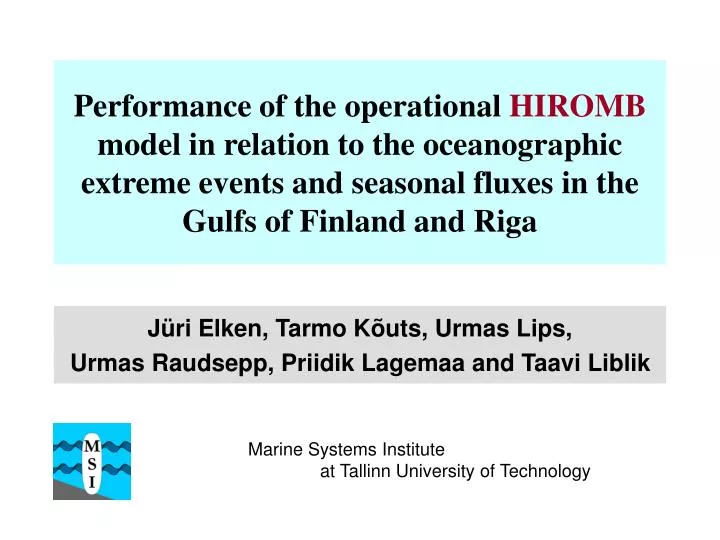
Performance of the operational HIROMB model in relation to the oceanographic extreme events and seasonal fluxes in the Gulfs of Finland and Riga. Jüri Elken, Tarmo Kõuts, Urmas Lips, Urmas Raudsepp, Priidik Lagemaa and Taavi Liblik. Marine Systems Institute

E N D
Performance of the operational HIROMB model in relation to the oceanographic extreme events and seasonal fluxes in the Gulfs of Finland and Riga Jüri Elken, Tarmo Kõuts, Urmas Lips, Urmas Raudsepp, Priidik Lagemaa and Taavi Liblik Marine Systems Institute at Tallinn University of Technology
Pärnu 9 January 2005 5th Study Conference on BALTEX
Flood in Pärnu, 9 January 2005 5th Study Conference on BALTEX
Flood in Haapsalu, 9 January 2005 5th Study Conference on BALTEX
highest water level + 272 cm 9 January 2005 Sat/Sun night at local time 06:50 A posteriori sealevel forecast validation in Pärnu Operational models had not been earlier compared with observations in Pärnu Constant offset +30 cm was found and subtracted Storm, January 2005 5th Study Conference on BALTEX
Marine Core Services in GMES From GMES MCS Implementation Group report by P.Ryder & al In a few years, operational measurements and model results will be free for everybody 5th Study Conference on BALTEX
HIROMB High Resolution Operational Model for the Baltic Presently based on BSH-Cmod BS01 grid 1’ by 5/3’ 16 vertical layers surface 4 m • SMHI HIROMB version 3.0 • operational since 15.11.2005 • - turbulence scheme 5th Study Conference on BALTEX
Further contents: • sealevel measurements & forecasts • temperature and salinity forecast errors • upwelling summer 2006: analysis 5th Study Conference on BALTEX
BOOS sealevel network www.boos.org Estonia: 6 on-line stations operated by MSI Pärnu Tallinn Paldiski Sillamäe Sõru Lehtma http://on-line.msi.ttu.ee/?jaam=parnu&periood=518400 5th Study Conference on BALTEX
Validation of HIROMB sealevel time series based on automatic forecasts in Pärnu 48h forecasts automatically delivered to EMHI, responsible natural authority to give warnings on natural hazards zero drift subtracted • errors due to: • “zero drift” • phase lag of • oscillations • river effects • wave setup? "on-line evaluation" by the experts needed at extreme sealevels 5th Study Conference on BALTEX
Problem of “zero drift” in sealevel forecasts Seasonal behavior similar to Gästgifvars et al., 2004 (HIROMB Workshop): minimum bias in winter, maximum bias in summer Reasons: biased flow resistance in Danish Straits (Grode, 2004, HIROMB Workshop) distorted filling-up and withdrawal of Baltic Sea volume (=mean sealevel) ??? 5th Study Conference on BALTEX
media events Observed and 24h forecasted sea levels (cm) in Pärnu during the stormy period from 01.10.2006 to 03.02.2007 5th Study Conference on BALTEX
Temperature and salinity forecast errors in the Gulf of Finland • Comparison with: • T and S surface transect by Ferrybox between Tallinn-Helsinki • SST from satellite image • CTD profiles, repeated transects Tallinn-Helsinki 5th Study Conference on BALTEX
Temperature and salinity forecasts in the Gulf of Finland: comparison data sets 2005 FerryBox Tallinn-Helsinki, 2005 2 times a day, TS recorded each 150 m 17 August - 27 September gaps 18-19, 29-30 August and 14-22 September cloud-free MODIS images Dominating observed patterns: upwelling near Finnish coast due to SW winds 3-25 September south-north change 25 September: temperature 15.20C 10.50C salinity 5.8 psu 5.2 psu filaments and squirt eddies 5th Study Conference on BALTEX
Temperature and salinity forecasts in the Gulf of Finland: validation with FerryBox / Alg@line results 2005 HIROMB-Alg@line difference (old) HIROMB vs Alg@line Temperature: Estonian coast ~ 0.60C lower, Finnish coast ~ 1.30C higher Salinity: Estonian coast ~ 0.5 psu higher, Finnish coast ~ 1 psu lower = strong along-basin “artificial” salinity front “true” upwelling and eddies not reproduced 5th Study Conference on BALTEX
Temperature Temperature Salinity Salinity 3 Sept, 2006 5 Sept, 2006 7 Sept, 2006 Surface data Comparison with FerryBox Tallinn-Helsinki 2006 September Tallinn Helsinki “slopes” predicted, but salinity contrasts higher than observed 5th Study Conference on BALTEX
SST 9 August 2006 SST in the Gulf of Finland on 9 August, 2006 HIROMB model forecast Hiromb model forecast Hiromb model forecast MODIS image MODIS image MODIS image Cold water is brought to the surface in the Cold water is brought to the surface in the southwestern Gulf of Finland. southwestern Gulf of Finland. MODIS-HIROMB SST difference Statistics: Total, n=20689 Rmse=1.99 Reduced, n=20101 Rmse=1.37 MODIS: Rivo Uiboupin 5th Study Conference on BALTEX
Comparison withCTDTEMPERATURE profiles August-September 2006 Model and CTD Model – CTD difference Model has higher temperature 5th Study Conference on BALTEX
Comparison withCTD SALINITY profiles August-September 2006 Model and CTD Model – CTD difference Model has generally lower salinity, except for the surface 5th Study Conference on BALTEX
Analysis of upwelling in summer 2006 in the Gulf of Finland • wind • CTD and model transects Tallinn-Helsinki • model time series • transports 5th Study Conference on BALTEX
Cumulative north-south Ekman transport in 2006 calculated from the wind data westerly wind yields southward transport (negative) westerly winds easterly winds mean speed 5 m/s m2/s (per unit section) 5th Study Conference on BALTEX
CTD and model transects Tallinn-Helsinki 8 August 2006 CTD HIROMB model 5th Study Conference on BALTEX Tallinn Helsinki
CTD transects Tallinn-Helsinki Temperature Salinity 8 August 2006 15 August 2006 5th Study Conference on BALTEX spacing 2.6 km, 27 stations
salinity increase in deep layer Time difference of CTD transects Tallinn-Helsinki 15 August – 8 August 2006 Temperature Salinity 5th Study Conference on BALTEX
salinity increase in deep layer HIROMB time series May-October 2006 Gulf of Finland station F3 Gulf of Riga station G1 5th Study Conference on BALTEX
W E Transports in the Gulf of Finland mean transport separation depth 30 m Cumulative WE transports Cumulative upward transport through 30 m Reference: Total volume 1100 km3 Annual runoff 111 km3 Annual inflow 480 km3 5th Study Conference on BALTEX
HIROMB transects along the Gulf of Finland deep water inflow during easterly winds 5th Study Conference on BALTEX
Conclusions • HIROMB • sealevel forecast is good (± 15 cm), problem: zero drift • TS errors comparable to other models: major basin-scale features predicted well (at least qualitatively), mesoscale features not so good • besides practical importance, useful tool to plan measurements and make scientific interpretations • Upwelling in the Gulf of Finland • due to the estuarine channel geometry, upwelling-inducing winds affect also strongly the deep layers 5th Study Conference on BALTEX