Download
1 / 38
380 likes | 509 Vues
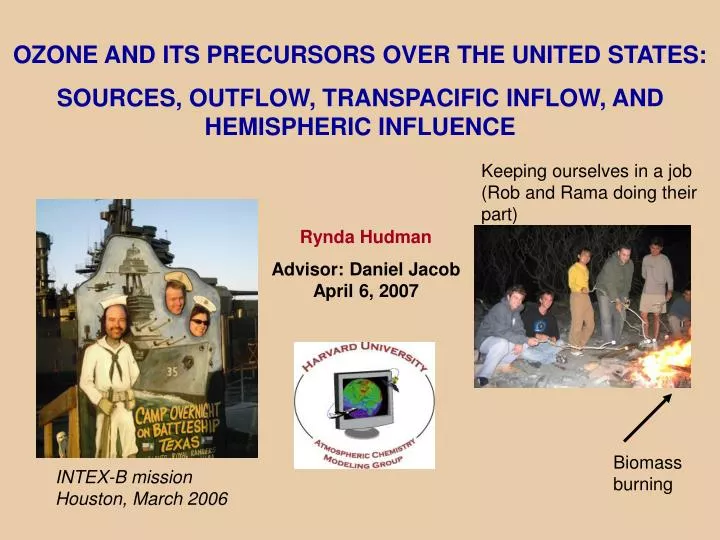
OZONE AND ITS PRECURSORS OVER THE UNITED STATES: SOURCES, OUTFLOW, TRANSPACIFIC INFLOW, AND HEMISPHERIC INFLUENCE. Keeping ourselves in a job (Rob and Rama doing their part). Rynda Hudman Advisor: Daniel Jacob April 6, 2007. Biomass burning.

E N D
OZONE AND ITS PRECURSORS OVER THE UNITED STATES: SOURCES, OUTFLOW, TRANSPACIFIC INFLOW, AND HEMISPHERIC INFLUENCE Keeping ourselves in a job (Rob and Rama doing their part) Rynda Hudman Advisor: Daniel Jacob April 6, 2007 Biomass burning INTEX-B mission Houston, March 2006
Alt (km) Intercontinental Influence of Ozone (1) primary constituent of smog in surface air [NRC, 1991] (2) 3rd most important greenhouse gas [IPCC, 2001] 10 Greenhouse gas 8 hn O3 NO NO2 6 Hemispheric Pollution 4 OH HO2 Direct Intercontinental Transport (1 week) 2 VOCs Air quality Air quality CONTINENT 1 CONTINENT 2 OCEAN
NORTH AMERICA : at midlatitudes we are all in each others tailpipe CO column GMAO Forecast Friday, 4/20/06 - Mon, 4/24/06 CO is used as a tracer of pollution IN OUT My work focuses on • Export • Transatlantic Transport • Background ozone • Transpacific transport • Local surface production • Convection/Lightning
RISING OZONE BACKGROUND AT NORTHERN MID-LATITUDES Mountain sites in Europe 1870-1990 U.S. Pacific coastal sites 1985-2002 Marenco et al. [1994] Jaffe et al. [2003] What is North American impact on ozone from biomass burning, fossil fuels, and lightning?
SENSITIVITY OF SIMULATED SURFACE OZONE TO ANTHROPOGENIC EMISSIONS IN INDIVIDUAL CONTINENTS N. America Sept 1997 Europe Asia [Li et al., 2002]
DEPLETION OF OZONE BACKGROUND DURING REGIONAL POLLUTION EPISODES Low-elevation CASTNet sites, Jun-Aug * CASTNet observations GEOS-Chem model Model background Regional Pollution Ozone (ppbv) Cumulative Probability How much does Asian pollution affect ozone air quality in the United States? Fiore et al., [2002]
SOURCES, OUTFLOW, TRANSPACIFIC INFLOW, AND HEMISPHERIC INFLUENCE RESEARCH Questions: • INFLOW: How is ozone produced during transpacific transport of Asian pollution, and what are the implications for surface ozone air quality in the U.S.? • SOURCES and CHEMICAL EVOLUTION: How well constrained are U.S. CO and NOx sources from combustion and lightning? Can we relate the trend in the ozone-CO relationship in the U.S. boundary layer outflow to changes in OPE and emissions? • OUTFLOW AND INFLUENCE: How does NOx evolve in the U.S. boundary layer and what are the implications for NOx export?What is the impact of NA biomass burning, lightning and anthropogenic export on hemispheric ozone? TOOL: GEOS-CHEM: 3-D coupled ozone-NOx-VOC-aerosoltropospheric Chemistry Model [Bey et al., 2001] (uses assim. met.; 2ºx2.5º horiz. resn., 43 tracers) to interpret aircraft observations of ozone and its precursors
SUMMER Alt (km) SPRING MAJOR FINDINGS SOURCES AND EXPORT BBNA FFLightning 10 NOx/flash 4X larger than previously thought! 8 6 Export well constrained 4 2 NOx stationary sources 22% effects on O3 & OPE Anthropogenic CO 60% O3 (ppbv) INFLOW Subsidence Over E Pacific Asian Plume PANNOxHNO3 strong O3 X10 Dilution Asia Europe North America
MAJOR FINDINGS (2) 2004 NA Biomass burning enhanced ozone 2-6 ppbv over Europe! North American (NA) enhancement to Northern Hemisphere summertime ozone burden Northern Hemisphere Burden Asia Europe North America
NOAA/ITCT-2K2 AIRCRAFT CAMPAIGN IN APRIL-MAY 2002 Monterey, CA High-ozone Asian pollution plumes observed in lower free troposphere but not at surface (Trinidad Head) May 5 plume at 6 km: High CO and PAN, no O3 enhancement O3 CO PAN HNO3 May 17 subsiding plume at 2.5 km: High CO and O3, PANNOxHNO3 Hudman et al. [2004] Measurements (NOAA WP-3D): T. Ryerson (O3, NOx), John Holloway (CO), Frank Flocke (PAN), Andy Neuman (HNO3)
Subsidence Over E Pacific Gross OPE 60-80, low OH PANNOxHNO3 PAN NOx HNO3 CONCEPTUAL PICTURE OF OZONE PRODUCTIONIN TRANSPACIFIC ASIAN POLLUTION PLUMES GEOS-CHEM Hudman et al. [2004] Stratospheric downwelling Warm conveyor belt; 5-10% export of NOy mainly as PAN PAN, weak O3 strong O3 Asian boundary layer (OPE ~ 5) U.S. boundary layer 10x dilution (Asian dust data) very weak O3 E. Asia Pacific United States Hudman et al. [2004]
CALIFORNIA MOUNTAIN SITES ARE PARTICULARLY SENSITIVE TO ASIAN OZONE POLLUTION Observed 8-h ozone at Sequoia National Park (1800 m) in May 2002 vs. corresponding simulated (GEOS-CHEM) Asian pollution ozone enhancement May 17 obs. Asian plume event in red Asian enhancements are 7-10 ppbv during NAAQS exceedances; unlike at surface sites, Asian pollution influence is not minimum under high-ozone conditions! Hudman et al. [2004]
ICARTT: COORDINATED ATMOSPHERIC CHEMISTRY CAMPAIGN OVER EASTERN NORTH AMERICA AND NORTH ATLANTIC IN SUMMER 2004 SCIENTIFIC OBJECTIVES • Regional Air Quality • Continental Outflow • Transatlantic Pollution • Aerosol Radiative Forcing
Biomass burning 2004Persistent Alaskan and Canadian burning CO June – August 2004 Canada Canadian National Forest Fire Situation Report Sept 8, 2004(http://www.nrcan.gc.ca/cfs-scf/redirects/fire/) Wildfires in Alaska: > 2,500,000 Hectares! Alaska Fire services: “The largest fire season in Alaska’s rich history ” Biomass burning inventory created using MODIS hotspots and daily area burned [Turquety et al., 2007]
Flash counts (flashes/km2/s) GEOS-CHEM SIMULATION Modifications from ICARTT constraints in blue (improved) NOx Lightning Emissions Lightning X4 over U.S. & distributed to tropopause [Price and Rind, 1992] NOx emission EPA National Emissions Inventory 1999 v1 (w/ modifications to VOCs) Power plant and Industry NOx 50% Anthropogenic CO 60% CO emissions May-August 2004 NA Fire Inventory [Turquety et. al, 2007]
GEOS-CHEM VS. ICARTT Mean comparison along the flight tracks Ozone FT bias 5-10 ppbv Large UT NOx bias BL bias in CO and NOx Measurements (WP-3D, DC-8): CO (J. Holloway, G. Sachse), NOx (T. Ryerson, R. Cohen, W. Brune), PAN (F. Flocke, H. Singh), HNO3 (A. Neuman, J. Dibb), ozone (T. Ryerson, M. Avery)
ICARTT OBSERVATIONS CONFIRM LARGE DECREASE SINCE 1999 IN INDUSTRY/POWER SOURCE Large overestimate powerplant/industry dominated Midwest and in the South Model / Observed NOx (0-2 km) DC-8 Midwest Observed Simulated Improved Simulation [ratio] 50% reduction in power and industry source as determined by Frost et al., [2006] improves boundary layer NO2 simulation Hudman et al. [2007a,b] Measurements (WP-3D, DC-8):T. Ryerson (NO2), Ron Cohen/Tim Bertram (NO2)
OZONE REDUCTIONS RESULTING FROM DECREASE IN NOx EMISSIONS Regional differences in ozone, can be explained by OPE: OPE Midwest: 2.5-3.5 Southeast: 4-5.5 Can we see changes in OPE due NOx emission reductions in dO3/dCO in U.S. outflow? Requires good estimate of CO source….. Hudman et al. [2007b]
BOTH AIRCRAFT AND SURFACE DATA SUGGEST NEI 99 CO EMISSIONS ARE 2.5 TIMES TOO HIGH Measurments: J. Holloway, G. Sachse, A. Goldstein SIMULATED (anthro CO reduced by 60%) SIMULATED (NEI99) OBSERVED Measurments: J. Holloway, G. Sachse Aircraft (0-1.5 km) Measurments: A. Goldstein/ Dylan Millet Chebogue Point (surface) Hudman et al. [2007b]
SCATTERPLOT OF SIMULATED TO OBSERVED CO Parrish [2006] finds on-road source overestimated by 50% in NEI 99 (~33% reduction in NEI source) CO decrease trend 3.7% yr-1 (1987-2002), (12% reduction in NEI source since 1999) This estimate 2004 emissions 45% lower than NEI 99 Hudman et al. [2007b]
ANTHROPOGENIC CO SOURCE IN THE UNITED STATES IN SUMMER IS NOW LOWER THAN BIOGENIC SOURCE NEI 99 NEI 99 with 60% reduction in CO SOURCE TYPE (Tg CO) CO ANTHROPOGENIC EMISSION (11.5, 4.6) CO SOURCE FROM ANTHROPOGENIC VOC OXIDATION (1.8, 1.8) CO SOURCE FROM ISOPRENE OXIDATION (6.7, 6.7) CO SOURCE FROM OTHER BIOGENIC OXIDATION (2.4, 2.4) CO SOURCE FROM OTHER BIOMASS BURNING OVER CONTINENTAL U.S.(0.16, 0.16) Note: Fires in Canada and Alaska ~19 Tg CO
OZONE-CO CORRELATIONS SHOW DECADAL INCREASE Chebogue Point Aircraft (0-1.5 km, 11-5pm LT) ALL WIND DIRECTIONS WINDS FROM W-SE Overestimate of tropical background Obs during the early 90s show dO3/dCO ~ 0.3 – 0.4 [Chin et al., 1994; Parrish et al., 1998]. Change could be due to decadal changes in emissions Hudman et al. [2007b]
OBSERVED dO3/dCO INCREASE OVER THE PAST DECADE CONSISTENT WITH UNDERSTANDING OF OPE AND SOURCES dO3/dCO OPE (dO3/dNOx) * NOx/CO source ratio (dNOx/dCO) Consider NE U.S., July 1 – August 15, 2004 (With ICARTT Constraints) Anthro = 1.2 Tg CO, 0.10 Tg N Biogenic = 0.87 Tg CO July 1 – August 1994 4.9% anthro decrease/year in urban air [Parrish, 2006] Total CO 26% higher 22% stationary NOx reduction [Hudman et al., 2007] Anthro NOx 15% higher OPE lower by ~9% NOx/CO source ratio lower by ~19% ~28% increase in dO3/dCO expected 0.3-0.4 (90s) 0.4-0.5 (present) Multiply dO3/dCO * ECO 1.5 Gmol ozone d-1 (Ozone flux consistent with 1990s estimates)
SPECIATION AND EXPORT OF BOUNDARY LAYER NOx Onshore % Offshore % OBSERVED GEOS-Chem Model successfully simulates boundary layer NOy NOx We find observed f = 16 10% and modeled f = 14 9%(2.5-6.5km) 18% 7% PAN f= export efficiency R = ECOanthro/ENOxanthro = NMVOC CO production 20% 9% HNO3 Export to the lower free troposphere is mostly HNO3 but at higher altitudes is mostly PAN. 62% 84% Hudman et al. [2007a]
UT NOx OBSERVATIONS POINT TO A LARGER THAN EXPECTED LIGHTNING NOx SOURCE NOx (8-12 km) Observed GEOS-Chem (Lightning X4) [ppbv] DOESN’T APPEAR TO BE A NOx LIFETIME ISSUE Hudman et al. [2007a] NO: W. Brune, NO2: R. Cohen/T Bertram
FLASH RATES WELL SIMULATED POINTING TO A LARGER YIELD/FLASH AT NORTHERN MIDLATITUDES Lightning parameterization (flashes/km2/s): Land : ~CTH4.9 , Ocean: ~CTH1.73 CTH= Cloud Top Height Price and Rind [1992] Flash Comparison GEOS-Chem GEOS-Chem Vertical Distribution Pickering et al.,[1998] [Flashes km2 s] NLDN Hudman et al. [2007a]
PEAK CURRENT AS A FUNCTION OF LATITUDE [Huntrieser et al., 2005]
NO PRODUCTION RATE CALCULATED FROMR RECENT CAMPAIGNS Standard GEOS-Chem mean flash rate was 125 mol flash-1 (Improved X4 500 mol flash-1) [Ken Pickering]
OZONE COMPARISON INTEX-NA SOUTHEAST U.S.Increase in lightning yield X4 to 500 mol/flash has ~10 ppbv effect on ozone O3 NO2 2004 was not an anomalous lightning year Observed Simulated Improved Simulation …suggests great sensitivity of ozone to climate change Hudman et al. [2007a]
SUMMERTIME NORTH AMERICAN OZONE ENHANCEMENTS ICARTT DC-8 ~ Equal contributions for lightning and anthropogenic emissions in free troposphere and to NH burden NA Enhancement to Hemispheric Ozone Biomass Lightning Anthropogenic Simulated Observed All Hudman et al. [2007b]
NORTH AMERICAN ENHANCEMENT TO HEMISPHERIC OZONE Hudman et al. [2007b]
MAJOR FINDINGS (1) • PAN decomposition represents a major and possibly dominant component of the ozone enhancement in transpacific Asian pollution plumes. • A factor of 10 dilution of Asian pollution plumes takes place during entrainment in the U.S. boundary layer, greatly reducing their impact at U.S. surface sites. • California mountain sites are more sensitive to Asian pollution because of their exposure to the free troposphere. Asian enhancements are 7-10 ppbv during NAAQS exceedances; unlike at surface sites, Asian pollution influence is not minimum under high-ozone conditions. • A 50% summertime powerplant/industry NOx reduction source 1999 results in an 4 – 8 ppbv reduction in ozone at the surface with maximum effect in the southeast. • Anthropogenic CO emission in NEI 99 is overestimated by 60%. • The biogenic CO source now exceeds the anthropogenic source in summer.
MAJOR FINDINGS (2) 7. dO3/dCO in NA boundary layer outflow is ~28% higher than in the early 1990s, consistent withour understanding of changes in OPE and emissions. 8. Lightning is the dominant source of UT NOx over United States during the summer and had ~10 ppbv impact on upper tropospheric ozone. 9. Successful simulation of lightning over the U.S. requires a factor of 4 increase in NOx yield to 500 mol flash-1. 10. Lightning & Anthropogenic emissions each enhance ozone by 10-15 ppbv in the upper free troposphere over the U.S. Biomass burning enhancement over the Eastern U.S. was greatest below 4 km (~3-4 ppbv). 11. Lightning & anthropogenic emissions have a roughly equal enhancementto hemispheric ozone (~5%) during the summer. 12. Biomass burning emissions enhance surface ozone over Western Europe by 3-5 ppbv, comparable to the enhancement from fossil fuel.
Acknowledgements "If you light a lantern for another, it will also brighten your own way" -- Nichiren Daishonin (Gosho Zenshu, p. 1598). • I would like to whole-heartedly thank my advisor, Daniel Jacob, who is a brilliant scientist, patient mentor, and a good person. • The research group (past and present) + Justin, Jenny, Peter, Moeko Disclaimer: I am not leaving
More Acknowledgements • “THANKS” Lee Murray • Bob Yantosca, Jack Yatteau, and Phillipe Le Sager • Brenda Mathieu, Cecilia McCormack • Dylan Millet, Colette Heald, Soléne Turquety, Lin Zhang, Folkert Boersma, Qinbin Li, Lyatt Jaeglé, Qing Liang, Mat Evans • ITCT 2k2/PEACE, ICARTT, INTEX-B Science Teams…in particular Yutaka Kondo, Jim Crawford, Hanwant Singh, David Parrish, Owen Cooper • Jennifer Logan and Loretta Mickley (New bosses) • NSF and AMS/NOAA graduate fellowships • **This work was funded by NOAA Office of Global Programs, NASA Global Tropospheric Chemistry Program Disclaimer: I am not leaving
Even more Acknowledgements • My mom and Henry a constant source of support and love. The rest of my family! • Rob Kay (Thanks for coming Penny and Mark!) • Some dear friends: Debbie Sorenson, Nenita Elphick, Julie Schlenker, May Fu, Monika Kopacz, Colette Heald, Noelle Eckley, Mary Farrow, Yaping Xiao • My great friends in the SGI-USA & World Peace Buddhist Society campus club Disclaimer: I am not leaving