Download
1 / 16
160 likes | 317 Vues
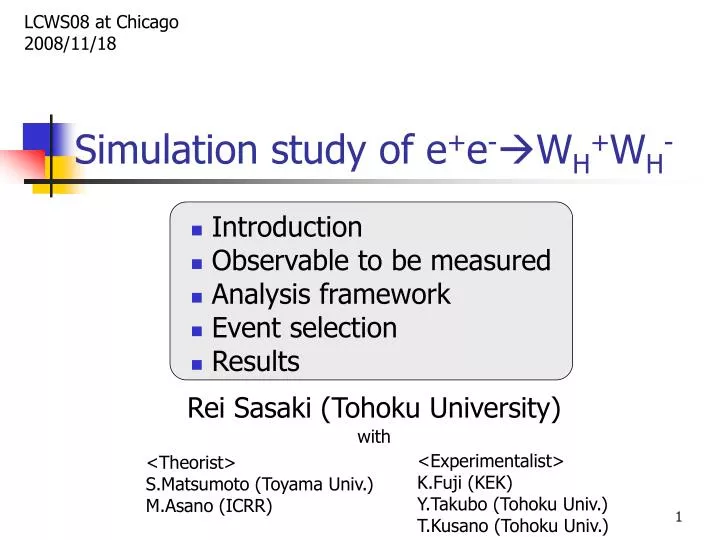
LCWS08 at Chicago 2008/11/18. Simulation study of e + e - W H + W H -. Introduction Observable to be measured Analysis framework Event selection Results. Rei Sasaki (Tohoku University) with. <Experimentalist> K.Fuji (KEK) Y.Takubo (Tohoku Univ.) T.Kusano (Tohoku Univ.).

E N D
LCWS08 at Chicago 2008/11/18 Simulation study of e+e-WH+WH- • Introduction • Observable to be measured • Analysis framework • Event selection • Results Rei Sasaki (Tohoku University) with <Experimentalist> K.Fuji (KEK) Y.Takubo (Tohoku Univ.) T.Kusano (Tohoku Univ.) <Theorist> S.Matsumoto (Toyama Univ.) M.Asano (ICRR)
Introduction A , W± , Z , h f F f- F- LH T T T LH AH, WH±, ZH, F Gauge-Higgs sector Matter sector Littlest Higgs model with T-parity <Particle contents> <WMAP constraint> <Mass> f : Breaking scale mh : Higgs mass AHand WH± can be searched by ILC (1TeV).
Introduction mass spin WH368.2(GeV) 1 AH81.85(GeV) 1 <Property> <Mass spectrum> <Mode> e+e- WH+WH- (WH±AHW±with 100% ratio) - Large cross section - Dark matter (AH) appears SM LHT e+e- WH+WH- is the best one to investigate the property of the dark matter predicted in the model.
Observable to be measured WH+ e+ q e- WH- j q W± j W+ WH+ e+ AH AH e- WH- W- 1) Energy edges of W± lead to masses of WH± and AH bosons 2) Production angle of WH± lead to spin of WH± boson 3) Angular distribution of reconstructed jets from associated W± boson decays lead to helicity of W± boson
Analysis framework <Event generation> MadGraph : for LHT process Physsim : for Standard Model process - helicity amplitude calculation - gauge boson polarization effect - phase space integration and generation of parton 4-momenta MadGraph Physsim PYTHIA <Hadronization> PYTHIA - parton showering and hadronization QuickSim <Detector simulation> JSFQuickSimulator - create vertex-detector hits - smear charged-track parameters in central tracker - simulate calorimeter signals as from individual segments
Analysis framework <Simulation setup> • Center-of-mass energy : 1TeV • Integrated luminosity : 500 fb-1 • Beam polarization : no • Crossing angle ofbeams : no • Beamstrahlung : ignored • Initial-state radiation : ignored <Detector parameter> Ref) GLD Detector Outline Document Ver.1.2.1
Event selection A/Z <Signal> • e+e-WH+WH- • - WH± decays to AHW± • - followed by W±qq-bar • Large missing energy • 4 jets in final state <Diagram> <Event display>
Event selection <LHT background> e+e-ZHZH - ZH decays to AHh - followed by hqq-bar <Standard Model background> (Large cross section) e+e-W+W- e+e-e+e-W+W- (Small cross section) e+e- nnW+W- e+e- W+W-Z - followed by W±qq-bar Znn-bar
Event selection <Selection cut> All events are forced to 4 jets in final state cW2 : c2 for W± reconstruction from jets PTmiss : Missing transverse momentum <Cut statistics and breakdown of efficiency> #event (efficiency) W+W- and e+e-W+W- are effectively reduced by PTmiss cut. ZHZH is negligible after cW2 cut. nnW+W- andW+W-Z remain after 2 cuts.
Result • Energy edge of W± • - Fit method • - Result of fit • 2) Production angle of WH± • - Reconstruction of WH± from W± • - cosq distribution • 3) Angular distribution of reconstructed jets • from associated W± boson decays • - Boost jets to W± rest frame • - |cosq| distribution
1) Energy edges of W± <Fit function> <Fit step> 1) Cheat Emin,Emax Ffit1 = Ferror(par[1,2]) Get resolution(par[1,2]) 2) CheatEmin,Emax & Fixpar[1,2] Ffit2 = Ferror x Fpoly(par[3~9]) Get shape(par[3~9]) 3) Fixpar[1~9] Ffit3 = Ferror(Emin,max) x Fpoly(Emin,max) Get edge(Emin,Emax) Calculate mass(mAH,mWH)
1) Energy edges of W± mTrue-mFit sFit accuracy= Signal (with all error) Fit line Subtract B.G. <Result of fit> (True) mAH=81.85 mWH=368.2 mAH = 82.49±1.10 : 0.58 mWH = 367.7±1.0 : 0.50 Masses of AH and WH± are determined with high accuracy!!
2) Production angle of WH± W+ WH- WH+ W+ W- WH+ sol1 sol2 true e+ AH AH e- WH- W- <Reconstruction of WH± from W±> WH± candidates are reconstructed as corn around W±. If WH+ and WH- are assumed as back-to-back, there are 2 solutions for WH± candidates. In this mode, however , 2 solutions should be close to true WH±. <WH+ of generator information> q
2) Production angle of WH± WH+ e+ q e- WH- <WH+ and WH- of detector simulation> This shape shows WH± spin as spin-1.
3) Angular distribution of jets j1 j2 W+ WH+ e+ AH e- j1 q W+ j2 <Angular distribution of jets> <Lab frame> Boost <Rest frame of W+> This shape shows W± helicity as longitudinal mode.
Conclusion • e+e-WH+WH- is the best mode • to investigate the LHT model. • Background candidates are W+W-, e+e-W+W-, ZHZH , • nnW+W- and W+W-Z. • Selection cuts, cW2<10 and PTmiss>50(GeV), • reduce effectively backgrounds. • 1) Masses of AH and WH± are determined • with high accuracy: 0.58 and 0.40. • 2) Spin of WH±can be determined as spin-1. • 3) Helicity of W±can be determined as longitudinal mode.