Download
1 / 28
280 likes | 463 Vues
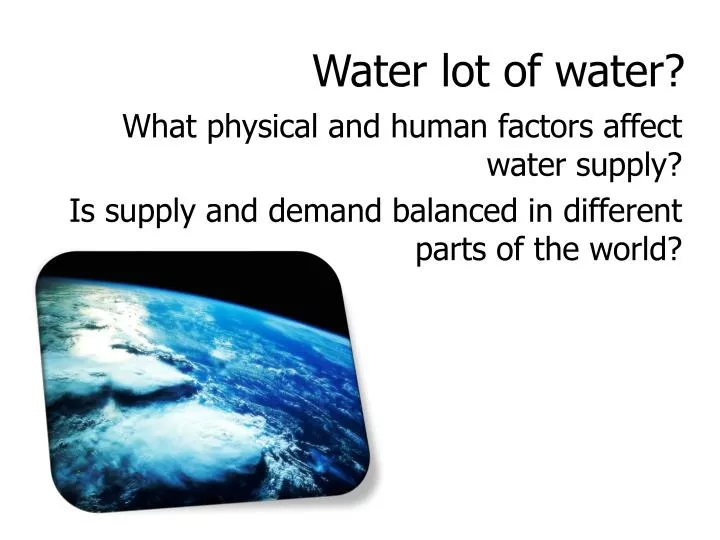
Water lot of water?. What physical and human factors affect water supply? Is supply and demand balanced in different parts of the world?. Human influences on water supply and demand . Humans affect the hydrological cycle at many points of flows and storage:. Graphs p 34 and 35 Pearson.

E N D
Water lot of water? What physical and human factors affect water supply? Is supply and demand balanced in different parts of the world?
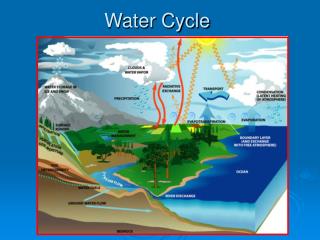
Human influences on water supply and demand • Humans affect the hydrological cycle at many points of flows and storage:
Graphs p 34 and 35 Pearson • How is water used on a worldwide scale? • How is water used in the UK?
Blue water flow is the visible part of the hydrological system: surface flows and then recharging aquifers • Green water flow is water intercepted, stored in soil and released by vegetation by evaporation and transpiration • Grey water is polluted water Supplycan be from: • Surface sources • groundwater sources • In the UK 2/3 of supply is from surface and 1/3 from groundwater, with regional variations. • Freshwater is effectively a finite resource since only about 1% of freshwater is easily available for human use. • The water footprint indicates how much is required by consumers- and in an increasingly globalised world, the footprint of someone in a country like the UK will not be just local as so many products using water will have been produced elsewhere!
The cost of everyday items ….in litres of water. One sheet of A4… One slice of bread… One apple.. One cup of coffee.. One pint of beer.. One pair of leather shoes.. One packet of mixed salad One bag of crisps.. One litre of milk.. One cotton tee-shirt.. One pair of jeans.. One 100g bar of chocolate.. One glass of wine..
The cost of everyday items ….in litres of water. One sheet of A4…10 One slice of bread…40 One apple..70 One cup of coffee..140 One pint of beer..75 One pair of leather shoes..16,600 One packet of mixed salad..50 One bag of crisps..185 One litre of milk..1000 One cotton tee-shirt..2700-4000 One pair of jeans..10,850 One 100g bar of chocolate..2400 One glass of wine..120
Thirst! • http://www.youtube.com/watch?v=e-wD4RfkYms
Water Supply In India High pressure due to descending air • Monsoon Climate • Due to the movement of the ITCZ • Little supply Dec – May • Monsoon June - Oct Brahmaputra Ganges Indus 2. Changing Discharge in the Ganges, Indus and Brahmaputra. This varies seasonally due to the Monsoon and snow melting in the Himalayas 3. Geology Aquifers in the North = good water supply Low Pressure due to the position of the ITCZ
Cherrapunji’s (in India)missing water? LO: Why can’t we have water everywhere? Why? Water scarcity isn’t just the fault of people
What are the physical and human reasons that water is an issue in Cherrapunji, India? Thinking • http://articles.timesofindia.indiatimes.com/2011-12-04/guwahati/30474076_1_drinking-water-water-resources-wettest-desert
Watch the clip and read the article…in pairs • Complete a table of the physical reasons and human human reasons why water supply in Cherrapunji has changed • Highlight where there are potential overlaps between the two columns. • Decide which of the reasons is the strongest by scoring them in order (1 for most important, X for least important. The strongest reason gets the lowest score)
Factors affecting Cherrapunji • Physical geography • Monsoon climate – variability • Saturation of ground – impervious • Climate change? • Human Geography • Lack of dams – can’t harness variable supply • Aquaculture, NOT agriculture • Overpopultion
Yemen • Sanaa, capital of Yemen, has no renewable water. At 2,300m above the sea, the city cannot use desalinated water and the only solution could be to move the capital. • Read p 38 Pearson
UK water supply Let’s examine the reasons for the variation in water demand and supply in the UK.
Estimated changes in demand for water 1990 - 2021 • Work out the estimated changes in different regions of the UK • Show this on the map after discussing with your partner • What are the advantages / disadvantages of the methods used?
Areas of water surplus /water deficit Using a range of Atlas maps and information, annotate the outline map of the UK to help identify the reasons why there is a water surplus /deficit in the areas identified. Add as much detail as you can around your map.
Water resources and climate change? • P 38 Pearson
The key players who affect the supply and demand for water? • Water companies • Governments – national and state/local authority • UN, WTO and TNCS • Agriculture • Industry/business • Recreation/tourism • Domestic users • Charities • Nature conservation
California p 52-59 Oxford Why are we doing this case study? ‘With reference to differing examples , explain how differing stakeholders views could lead to water conflict’ (15) ‘Referring to examples, assess the potential for water conflict in areas where demand exceeds supply’ (15) California p 52-59 Oxford
Explain the physical controls on the supply of fresh water in California (think about the climate, river systems and aquifers etc ) • How is human activity affecting the water availability in California? • What are different key players likely views on the water issues in California? • What are the environmental implications of supplying water to California? • What are the economic implications of supplying water to California? • IN DETAIL
7 states covered : Wyoming / Colorado New Mexico / Arizona California / Nevada Utah Why will conflict arise here ? Las Vegas 1.8 million Colorado 1 of the bread basket states Hoover Dam Mojave Desert Glen Canyon Dam Phoenix – 1.5 million residents Salt water : Pacific Ocean and gulf of California
History of the Colorado Basin • Colorado Compact 1922, allocated the water rights between the different states • 1920’s ‘law of the River’ divided the river into the Upper basin states, who had responsibility to supply the lower states • Over time new treaties have been signed and Mexico has also been involved • Now there is a ‘giant plumbing system’, with more than 10 major dams to give water to over 30 million people • Lots of the treaties were established in the 1920’s, since then population, industry and climate here have all changed
Complete the Conflict matrix, but also put in their opinions in detail in the first column