Download
1 / 14
140 likes | 143 Vues
This study focuses on the construction of a drought early detection system in Iran using Normalized Difference Vegetation Index (NDVI) data from NOAA/AVHRR. The research methodology involves the creation of standard and up-to-date NDVI images, calculation of difference NDVI images, and mapping of drought risk areas.

E N D
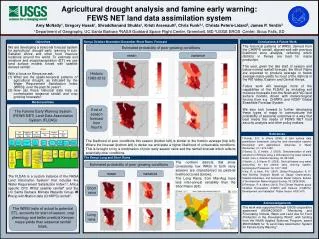
Construction of Drought Early Detection System in I.R.Of Iran Using NDVI from NOAA/AVHRR Data Alireza Shahabfar1, Azadeh Ramesh2 1. MSc. of Civil Engineering, I.R.of Iran Meteorological Organization (IRIMO) 2. MSc. of Geography, I.R.of Iran Meteorological Organization (IRIMO)
Introduction It is acknowledged that the major cause of drought is lower than average rainfall. In the other hand, drought defined as when the precipitation for the specific time period in the specific place was lower than long time average precipitation. Kinds of drought: • Meteorological drought • Agricultural drought • Hydrological drought • Socioeconomic drought When drought conditions are so intense and protracted that they may be considered as beyond the bounds of normal risk management practices, an area may be declared as experiencing drought exceptional circumstances (DEC). Such events are likely to occur only once in 20-25 years and to be greater than 12 months in duration (White & O’Meagher 1995, White 1997).
Using Remote Sensing for Drought Studies Remote sensing is the acquisition of digital data in the reflective, thermal or microwave portions of the electromagnetic spectrum (EMS). Due to large spatial extent of drought in many areas in the world. Scientists will focus on data gathered from satellite remote sensing system. There are many sensors on board numerous satellites, which can be used to assist prediction of drought decision-making process. Remote sensing of the surface occurs at wavelengths of the EMS where light can pass through the earth’s atmosphere with no, or little interaction. These bands of EMS are called atmospheric windows. One of the best methods to distinguish of drought conditions is the vegetation monitoring with reflective remote sensing. the reflective of the EMS ranges normally from 0.4 to 3.7μm.Some of indices are defined for vegetation monitoring such as NDVI (Normalized Difference Vegetation Index).
Methodology We use the changes of up-to-date and normal NDVI from NOAA satellite’s images in AVHRR format for detecting and monitoring drought effects on agriculture. Ideally, for detecting and monitoring drought, cloud-free satellite data are required. Therefore, to minimize the cloud effect, the largest NDVI value of every pixel is used for the daily, weekly and 10-day images. However, even using this method, we found that there are too many cloudy cover areas in the daily and weekly images, which makes it difficult to detect drought effects on agriculture using these data. On the other hand, monthly data are averaged over a period that is too long to describe the development of vegetation because morphological changes and leaf appearances occur in a shorter period. Therefore, in this work, the detection and monitoring of drought effects on each 10-day interval are discussed. The algorithm of this research is that: The standard NDVI images are created first. Then, the up-to-date NDVI is calculated just after the 10 days and cloud pixels are masked for elimination. And then, the difference NDVI images between the standard and up-to-date NDVI images are calculated. Lastly, using the difference NDVI image, it is possible to detect the area and intensity of drought damage on agriculture. The bigger negative difference pixels are listed as drought areas, and the values of difference NDVI show the intensities of the drought damages.
Observation Area (I.R.of Iran) Data Processing at Computer Center Satellite Ground Stations (Tehran) Geometric Correction for NOAA/AVHRR Data Creating Standard NDVI Images Creating up-to-date NDVI Images Calculating The Difference NDVI Imaging The Difference NDVI Drought Risk Map
Creating the standard NDVI images The NOAA/AVHRR data in 1997–99 were selected for creating the standard NDVI images. In order to minimize the cloud effects, the 10-day NDVI images are created using the maximum value of every pixel. Then, the 10-day NDVI images are masked because there are also cloudy pixels even in this method. The cloudy pixels (NDVIv0) are substituted as the special value areas so that these pixels are eliminated when the averages of NDVI data are calculated. The average values of NDVI data in 1997–99 are those of standard NDVI images. Finally, the standard NDVI images are created. One example of the standard NDVI images is shown in the next slide .There are seven classes of NDVI values.
Creating the up-to-date NDVI image The up-to-date NDVI is calculated just after the 10 days and cloud pixels are masked for elimination. As described above, there are also cloudy pixels in the up- to-date 10-day NDVI image, even using the maximum value of each pixel for the daily and 10-day images. For these areas, it is impossible to monitor the change of vegetation. Therefore, these pixels are substituted as the special value area. In the NDVI image. These areas are shown in black(figure3).When the NDVI image is used, these areas will be eliminated. We do not discuss the changes of vegetation at-these-areas.
Creating the drought risk map The difference NDVI images between the standard and up-to-date 10-day NDVI images are calculated, and the drought risk maps are created using this difference NDVI. The bigger difference NDVI pixels are listed as the drought risk areas, and the values of this difference NDVI show the intensities of drought effects. The bigger negative difference pixels (difference NDVIv20.1) are listed as the drought risk areas (yellow and red areas are shown in the next slide), and the values of the difference NDVI show the intensities of drought damages.
One sample of the drought risk map by the difference NDVI between standard and up-to-date NDVI.
Conclusions In this research, using the changes of up-to-date and normal NDVI from NOAA/AVHRR data, an early detection system for drought is developed. The standard NDVI images are created using NOAA/AVHRR data in 1997–99. The drought risk maps are created. The drought risk maps in I.R.of Iran in 2000 are discussed as the example. Compiling the analyses of characteristics of NDVI graph and meteorological precipitation data, the drought effects on agriculture in 2000 are detected and monitored successful. It is shown that this system is possible and useful to detect the drought area and intensity on agriculture.
Thank you for attention An ancient bridge over the Zayandeh-rood river in Iran