Download
1 / 1

E N D
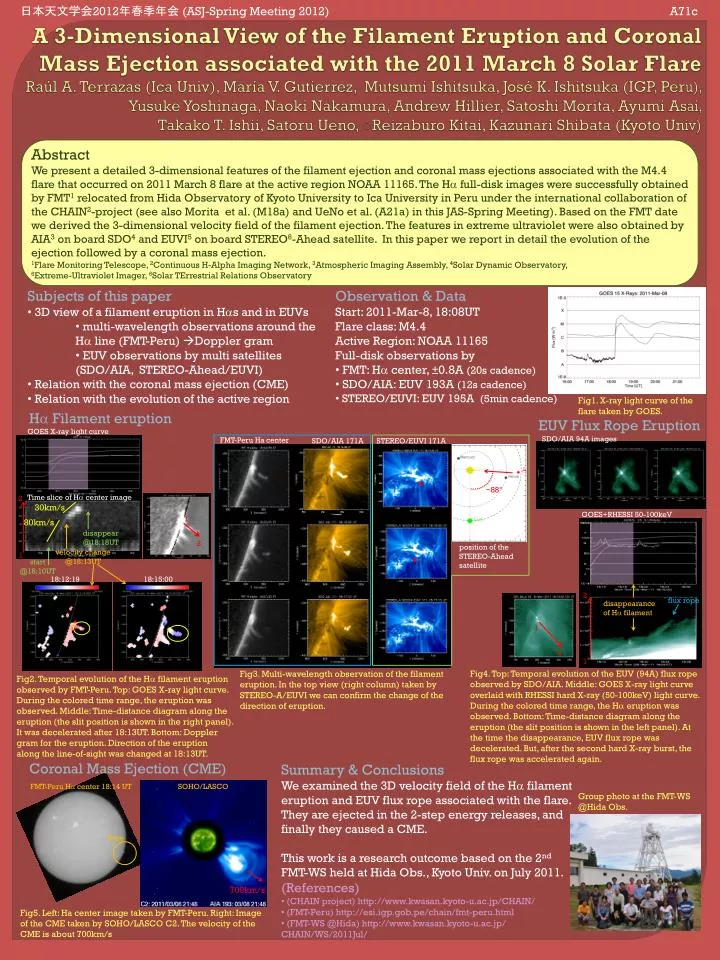
A 3-Dimensional View of the Filament Eruption and Coronal Mass Ejection associated with the 2011 March 8 Solar FlareRaúlA. Terrazas (Ica Univ), María V. Gutierrez, MutsumiIshitsuka, José K. Ishitsuka (IGP, Peru), Yusuke Yoshinaga, Naoki Nakamura, Andrew Hillier, Satoshi Morita, AyumiAsai, TakakoT. Ishii, Satoru Ueno, ○ReizaburoKitai, Kazunari Shibata (Kyoto Univ) 日本天文学会2012年春季年会 (ASJ-Spring Meeting 2012) A71c • Abstract • We present a detailed 3-dimensional features of the filament ejection and coronal mass ejections associated with the M4.4 flare that occurred on 2011 March 8 flare at the active region NOAA 11165. The Ha full-disk images were successfully obtained by FMT1relocated from Hida Observatory of Kyoto University to Ica University in Peru under the international collaboration of the CHAIN2-project (see also Morita et al. (M18a) and UeNo et al. (A21a) in this JAS-Spring Meeting). Based on the FMT date we derived the 3-dimensional velocity field of the filament ejection. The features in extreme ultraviolet were also obtained by AIA3on board SDO4and EUVI5 on board STEREO6-Ahead satellite. In this paper we report in detail the evolution of the ejection followed by a coronal mass ejection. • 1Flare Monitoring Telescope, 2Continuous H-Alpha Imaging Network, 3Atmospheric Imaging Assembly, 4Solar Dynamic Observatory, • 6Extreme-Ultraviolet Imager, 6Solar TErrestrial Relations Observatory • Subjects of this paper • 3D view of a filament eruption in Has and in EUVs • multi-wavelength observations around the Ha line (FMT-Peru) Doppler gram • EUV observations by multi satellites (SDO/AIA, STEREO-Ahead/EUVI) • Relation with the coronal mass ejection (CME) • Relation with the evolution of the active region • Observation & Data • Start: 2011-Mar-8, 18:08UT • Flare class: M4.4 • Active Region: NOAA 11165 • Full-disk observations by • FMT: Ha center, ±0.8A (20s cadence) • SDO/AIA: EUV 193A (12s cadence) • STEREO/EUVI: EUV 195A (5min cadence) Fig1. X-ray light curve of the flare taken by GOES. Ha Filament eruption EUV Flux Rope Eruption GOES X-ray light curve SDO/AIA 94A images FMT-Peru Ha center SDO/AIA 171A STEREO/EUVI 171A Time slice of Ha center image 2 30km/s GOES+RHESSI 50-100keV ~88° 1 80km/s disappear @18:18UT 2 position of the STEREO-Ahead satellite velocity change @18:13UT 1 start @18:10UT • 18:12:19 • 18:15:00 2 flux rope disappearance of Ha filament 1 2 1 Fig4. Top: Temporal evolution of the EUV (94A) flux rope observed by SDO/AIA. Middle: GOES X-ray light curve overlaid with RHESSI hard X-ray (50-100keV) light curve. During the colored time range, the Ha eruption was observed. Bottom: Time-distance diagram along the eruption (the slit position is shown in the left panel). At the time the disappearance, EUV flux rope was decelerated. But, after the second hard X-ray burst, the flux rope was accelerated again. Fig3. Multi-wavelength observation of the filament eruption. In the top view (right column) taken by STEREO-A/EUVI we can confirm the change of the direction of eruption. Fig2. Temporal evolution of the Ha filament eruption observed by FMT-Peru. Top: GOES X-ray light curve. During the colored time range, the eruption was observed. Middle: Time-distance diagram along the eruption (the slit position is shown in the right panel). It was decelerated after 18:13UT. Bottom: Doppler gram for the eruption. Direction of the eruption along the line-of-sight was changed at 18:13UT. Coronal Mass Ejection (CME) • Summary & Conclusions • We examined the 3D velocity field of the Ha filament eruption and EUV flux rope associated with the flare. They are ejected in the 2-step energy releases, and finally they caused a CME. • This work is a research outcome based on the 2nd • FMT-WS held at Hida Obs., Kyoto Univ. on July 2011. • (References) • (CHAIN project) http://www.kwasan.kyoto-u.ac.jp/CHAIN/ • (FMT-Peru) http://esi.igp.gob.pe/chain/fmt-peru.html • (FMT-WS @Hida) http://www.kwasan.kyoto-u.ac.jp/ CHAIN/WS/2011Jul/ FMT-Peru Hα center 18:14 UT SOHO/LASCO Group photo at the FMT-WS @Hida Obs. flare 700km/s Fig5. Left: Ha center image taken by FMT-Peru. Right: Image of the CME taken by SOHO/LASCO C2. The velocity of the CME is about 700km/s