Download
1 / 19
200 likes | 431 Vues
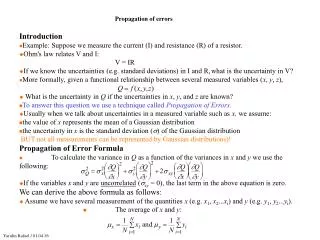
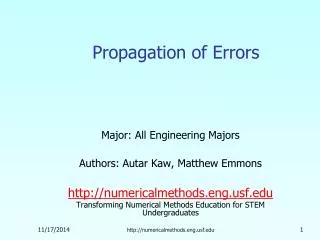
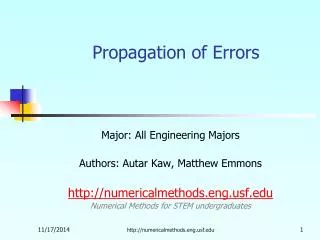
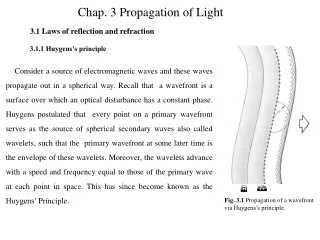
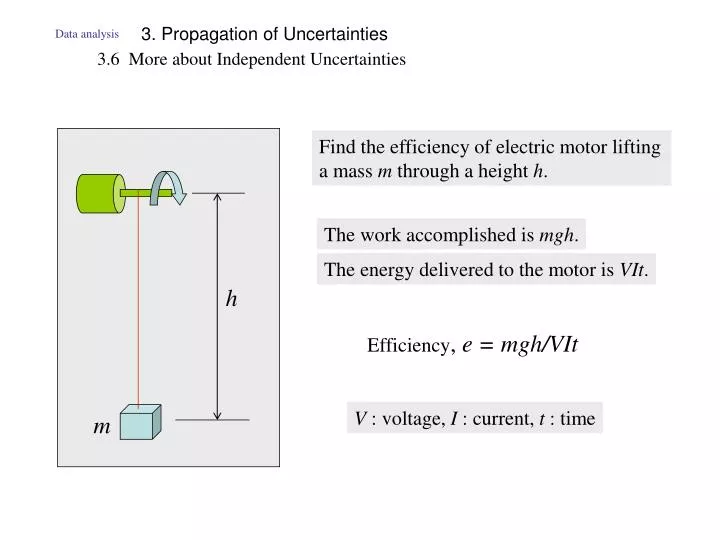
3. Propagation of Uncertainties. Data analysis. 3.6 More about Independent Uncertainties. Find the efficiency of electric motor lifting a mass m through a height h. The work accomplished is mgh. The energy delivered to the motor is VIt. h. Efficiency , e = mgh/VIt.

E N D
3. Propagation of Uncertainties Data analysis 3.6 More about Independent Uncertainties Find the efficiency of electric motor lifting a mass m through a height h. The work accomplished is mgh. The energy delivered to the motor is VIt. h Efficiency, e = mgh/VIt V : voltage, I : current, t : time m
Fractional uncertainty of the efficiency (old rule) 3. Propagation of Uncertainties Data analysis 3.6 More about Independent Uncertainties Efficiency, e = mgh/VIt Fractional uncertainties for m, h, V and I = 1% Fractional uncertainties for t = 5% h m
Quadratic sum 3. Propagation of Uncertainties Data analysis 3.6 More about Independent Uncertainties Efficiency, e = mgh/VIt Fractional uncertainties for m, h, V and I = 1% Fractional uncertainties for t = 5% Fractional uncertainty of the efficiency (old rule) QC3-6
l mass g Data analysis 3. Propagation of Uncertainties 3.9 Example A : Measurement of g (gravitational acceleration) from a simple pendulum experiment. Pivot
l mass g 3. Propagation of Uncertainties Data analysis A : Measurement of g (gravitational acceleration) from a simple pendulum experiment. 3.9 Example Product of 3 components Pivot
3. Propagation of Uncertainties Data analysis Measurement of g (gravitational acceleration) from a simple pendulum experiment. 3.9 Example
3. Propagation of Uncertainties Data analysis A : Measurement of g (gravitational acceleration) from a simple pendulum experiment. 3.9 Example g = 979 ± 4 cm/s2
3. Propagation of Uncertainties Data analysis 3.9 Example B : Refractive index using Snell’s law Snell’s law sini = n sinr i Air n : Refractive index Glass r
quotient quadratic sum 3. Propagation of Uncertainties Data analysis B : Refractive index using Snell’s law 3.9 Example
3. Propagation of Uncertainties Data analysis B : Refractive index using Snell’s law 3.9 Example Measured results
=SQRT(F4^2+G4^2) Microsoft Excel =ABS(1/TAN(A4*PI()/180))*(1*PI()/180) =SIN(A4*PI()/180) 3. Propagation of Uncertainties Data analysis B : Refractive index using Snell’s law 3.9 Example
3. Propagation of Uncertainties Data analysis 3.9 Example Microsoft Excel
Position 1 l Position 2 s q Data analysis 3. Propagation of Uncertainties 3.10 A More Complicated Example Measurement of acceleration
l s ts t2 t1 Data analysis 3. Propagation of Uncertainties 3.10 A More Complicated Example Detector 1 Detector 2 q Time trace Detector 1 Detector 2
Detector 1 Detector 2 Time trace q Detector 1 t1 Detector 2 l s ts t2 Data analysis 3. Propagation of Uncertainties 3.10 A More Complicated Example Measured results l = 5.00 ± 0.05 cm (1%) s = 100.0 ± 0.2 cm (0.2%) t1 = 0.054 ± 0.001 s (2%) t2 = 0.031 ± 0.001 s (3%)
Position 1 Position 2 q l s Data analysis 3. Propagation of Uncertainties 3.10 A More Complicated Example Velocity at Pos.1 v1 = l/t1 Velocity at Pos.2 v2 = l/t2 Measured results l = 5.00 ± 0.05 cm (1%) s = 100.0 ± 0.2 cm (0.2%) t1 = 0.054 ± 0.001 s (2%) t2 = 0.031 ± 0.001 s (3%)
Position 1 Position 2 q q1 q2 l s Data analysis 3. Propagation of Uncertainties 3.10 A More Complicated Example Measured results l = 5.00 ± 0.05 cm (1%) s = 100.0 ± 0.2 cm (0.2%) t1 = 0.054 ± 0.001 s (2%) t2 = 0.031 ± 0.001 s (3%)
Data analysis 3. Propagation of Uncertainties 3.10 A More Complicated Example q1 q2
Position 1 Position 2 q l s Data analysis 3. Propagation of Uncertainties 3.10 A More Complicated Example Measured results l = 5.00 ± 0.05 cm (1%) s = 100.0 ± 0.2 cm (0.2%) t1 = 0.054 ± 0.001 s (2%) t2 = 0.031 ± 0.001 s (3%) a = 87.2 ± 9% = 87 ± 8 cm/s2