Download
1 / 23
230 likes | 384 Vues
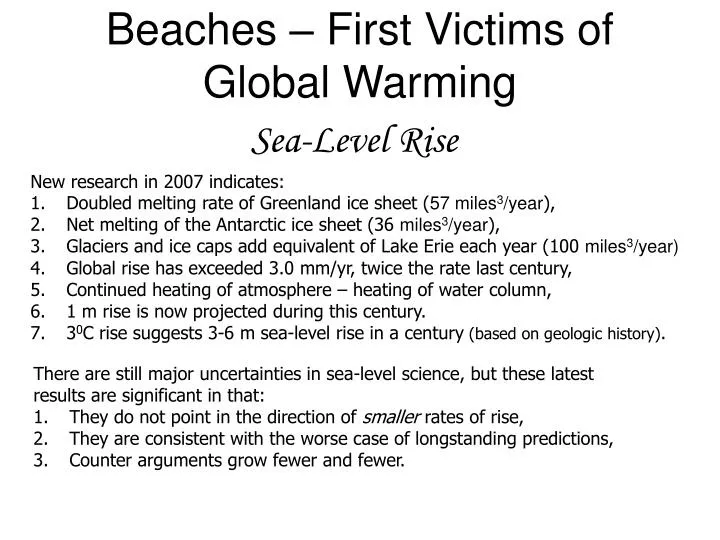
Beaches – First Victims of Global Warming. Sea-Level Rise. New research in 2007 indicates: Doubled melting rate of Greenland ice sheet ( 57 miles 3 /year ), Net melting of the Antarctic ice sheet (36 miles 3 /year ),

E N D
Beaches – First Victims of Global Warming Sea-Level Rise • New research in 2007 indicates: • Doubled melting rate of Greenland ice sheet (57 miles3/year), • Net melting of the Antarctic ice sheet (36 miles3/year), • Glaciers and ice caps add equivalent of Lake Erie each year (100 miles3/year) • Global rise has exceeded 3.0 mm/yr, twice the rate last century, • Continued heating of atmosphere – heating of water column, • 1 m rise is now projected during this century. • 30C rise suggests 3-6 m sea-level rise in a century (based on geologic history). • There are still major uncertainties in sea-level science, but these latest • results are significant in that: • They do not point in the direction of smaller rates of rise, • They are consistent with the worse case of longstanding predictions, • Counter arguments grow fewer and fewer.
Greenland • ice loss
Contributions to sea level • Total ice melt • Alpine glaciers and ice caps: 0.5 m • Greenland: 7.2 m • West Antarctic: 5-6 m • Sea level rise due to mountain glacier melt? ...~60% • Sea level rise due to Greenland? ...~28% • Sea level rise due to Antarctica? ...~12% • Sea level budget poorly understood
Correlation of rate of sea-level rise to temperature, 1881-2001 By correlating temperature history with sea-level history, Rahmstorf (2007) estimated future sea level position based on projections of future temperature. Rahmstorf, 2007 Science v. 315
Sea level history and projections 1990-2100 based on IPCC temperature range of 1.4 - 5.80C Sea-level rise of 0.5 to 1.4 m by 2100 Rahmstorf, 2007 Science v. 315 1 m rise by 2100 is a good target on which to base Hawaii management and policy decisions
What is the impact of a 1 m rise in Hawaii? • The water table will begin to break the ground surface, and rainfall/run-off will not drain. • In coming decades we will see the formation of permanent wetlands in urban areas. • Heavy rainfall (such as Spring ’06) will cause flooding lasting weeks. • Storm sewers are already backing up with sea water at high tide. • Coastal aquifers will increase salinity. • Coastal erosion will accelerate, ~100 ft recession for 1 ft sea-level rise These effects can be modeled using high-resolution topographic maps of the coastal zone (~25 cm in accuracy) • 1 m sea-level rise • +0.44 m high tide • +0.3 m heavy rain fall (April, 2006)
Mapunapuna is already experiencing the effects of rising sea level
Along Hawaii shores we will see increased erosion, and increased high wave flooding
Beaches? …what beaches?
With 1 m of sea-level rise, most of the Hawaiian shoreline will look like this and there will be no beaches
Will this impact tourism? Visitors may not mind beach loss – but locals do not go to resorts, we will experience a major impact to our quality of life.