Download
1 / 34
340 likes | 546 Vues
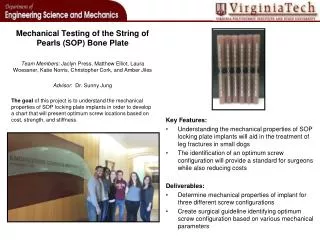
Summary of mechanical testing of PMTs. Milind Diwan 1/26/2011. PMT Pressure performance. Primary Objective: The primary objectives of these tests are to eliminate the risk of PMT implosion and its effect that can cause an implosion chain reaction in neighboring PMTs.

E N D
Summary of mechanical testing of PMTs • Milind Diwan • 1/26/2011
PMT Pressure performance • Primary Objective: The primary objectives of these tests are to eliminate the risk of PMT implosion and its effect that can cause an implosion chain reaction in neighboring PMTs. • Stage 0 small chamber tests conducted at BNL on two manufacturer’s PMTs have identified that each manufacturer’s PMT implodes via a different mode. DONE • Stage1-phase1 conceptual design and evaluation of a facility for testing of implosion abatement DONE • Stage1-phase2 is to refurbish and establish the facility for complete testing of implosion abatement. • In this stage we will measure the magnitude of shock wave pressure due to a single PMT implosion under hydrostatic pressure and to see how the shockwave magnitude varies while implosion. The mechanical design team, with the assistance of NUWC will analyze the test results to make sure the testing protocol is appropriate. DONE(to be reported here) • Stage 3 test will be testing of PMTs using the COMPLETELY designed implosion abatement scheme. Requirement of this test will be determined by Stage 2 tests.(We are now ready for this) 2
In Scope Define physical parameters (time scale, intensity, and distribution) of hydrodynamic pressure pulse due to breakage of a single PMT by means of analysis and experimentation. Impact on functional performance of neighboring PMTs in case of single PMT failure by pressure pulse Full scale testing of structural PMT support interface including an array of tubes and its reaction to single PMT failure pressure pulse . Out of Scope The following are considered out of scope of Test Plan: Material testing (PMT mounts, base etc.) Electrical Performance testing of PMTs+base assembly under pressure. PMT pressure performance 3
Facility for pressure testing Very large amount of documentation now on DOCDB. 4
Storage tank rated for 100 psig Pressure tank 50 ft diameter
For each sensor finger test and test DAQ Place PMT make sure cameras and lights work Test noise level, no good wet pretest exists Release pressure, start draining, secure data, photograph after draining. Procedure
5 6 2 3 1 4 11
Tank is pressurized with air upto 88 psi • Poker is activated by pressurization with nitrogen • For test on Dec. 16 poker was activated using a pressure accumulator. This failed at 1500 psi and succeeded at ~3000 psi • For test on Dec. 17 poker was activated slowly by continuously raising the pressure. Needed >4000 psi hydraulic poker Dec 16 test 8 7 11
Dec 16 test Setup for Dec 17 poker 1/16”
Conditions were cold, we had to time the events so that there was enough time for draining and refilling operation. Refilling took 12-14 hours for 1/2 tank due to slow filtering. Draining was faster.
Initial look at data Dec 16-RA0249 Dec 17-RA0284
200kHz data Speed of sound 1497 m/sec (at 25 C) Dec 16-RA0249 Dec 17-RA0284
Table Dec-16-2010 Sensor Max(psi) FWHM(us) integral(psi*s) ACC5 300.326 18 0.021201 ACC2 488.605 12 0.0239284 ACC1 427.451 14 0.0219069 ACC3 287.754 14 0.0179908 ACC4 410.826 11 0.0183837 ACC6 169.847 12 0.0102897 ACC11 802.362 22 0.0544762 Dec-17-2010 Sensor Max(psi) FWHM(us) integral(psi*s) ACC5 350 40 0.024515 ACC2 350 30 0.0224999 ACC1 337. 40 0.0206258 ACC3 290 30 0.0201209 ACC4 223.36 55 0.0191678 ACC6 154.65 30 0.010826 ACC11 1800.2 12 0.0730299
PMT Implosion TESTS Simulations & “blind” Predictions including: * NAVSEA PMT Implosion Tests * BNL Hydrostatic PMT Tests * Navy Glass Sphere Implosion Test and Bubble Oscillation Confirmation N. Simos Nuclear Science Department & Photon Science Directorate January 25, 2011 PMT Implosion Test Predictions 16
Benchmarking of implosion process against US Navy glass sphere tests and “exact” solutions of bubble oscillation PMT Implosion Test Predictions 17
VERIFICATION OF BNL IMPLOSION Model/Analysis: Experiments (Navy test on glass sphere implosion) Experiment Pressure Recordings at 102 mm from center Data to compare predictions against PMT Implosion Test Predictions 18
VERIFICATION OF BNL IMPLOSION Model/Analysis: “Exact” Solutions of Air Bubble Collapse/Oscillation “Exact” solution of bubble contraction/expansion “Exact” solution of bubble contraction/expansion Pressure generation BNL Simulation predictions. PERFECT match of contraction time to minimum bubble size, time arrival of pressure pulse and Pressure Pulse Amplitude PMT Implosion Test Predictions 19
PMT Implosion Tests BNL Hydrostatic Tests NAVSEA Tests PMT Implosion Test Predictions 20
Simulation were performed ahead of all BNL and NAVSEA Tests • Relied on: • Arbitrary Eulerian-Lagrangian (ALE) formulation that allows solids (PMT glass) and fluids to interface • Exact reproduction of the PMT shape of “varying” cross section/thickness • Large model to incorporate the surrounding water (for the NAVSEA test a model consisting of 2,240,000 solid and fluid elements requiring ~240 hrs of CPU for 6 msec implosion duration was used) PMT glass model PMT Implosion Test Predictions 21
Simulation Predictions confirmed by the BNL Tests: No shock develops !! Implosion process very long (20+ ms) Hydrostatic pressure limit ~270 psi (19 Atm) !!! PMT inner volume density evolution PMT fracture Tank Volume Pressure Drop (confirmed in test) Pulse arrival time 20+ micro-secs CONFIRMED by test PMT Implosion Test Predictions 22
BNL Hydrostatic tests and PMT instability predictions Predicted crack initiation/propagation Observed in the simulations is an instability mode which is influenced by the strength of the base (or neck) where failure seems to initiate at much lower than anticipated (2nd mode) external pressure. Hydrostatic tests at BNL showed similar results where PMTs failed hydrostatically at 19 Atm. PMT Implosion Test Predictions 23
“Blind” Predictions of the NAVSEA Implosion Tests PMT Implosion Test Predictions 24
Based on a 2,240,000+ fluid/solid element model and “adjusted” PMT glass constitutive and fracture relations, the implosion at 88 psi water pressure was simulated (~240 hrs CPU on a 8-cpu dedicated PowerEdge microstation) • Predictions of pressure pulse at various sensor locations were very close to the test results. • Also confirmed were the attenuation (as function of 1/r) and the pulse propagation velocity PMT fracture evolution Initiation & propagation of pressure pulse PMT Implosion Test Predictions 25
Pulse propagation velocity attenuation PMT Implosion Test Predictions 27
PMT Stress Analysis • - Rahul Sharma
Model Features, Loads and Constraints Applied • Model Features: • Pads around dome simulating PA holding PMT • PMT base encapsulation incorporated in the model • Split model and sweep mesh features used to get fine mesh • Loads and Constraints: • **Please note that values used for loads in the model may not be exact but are very close and can be modified • External Pressure of 7bar • Buoyant Force on PMT = 100 N (Assumption) • Gravitational Force • Pads constraining PMT dome • PMT base encapsulation constraining PMT close to neck
PMT Model Pads PMT Base Encapsulation PMT
Results • Maximum Stress of 16.64 MPa. • Maximum stress area after base encapsulation shifts to the neck of the tube. Maximum Stress Area
Development on glass testing • As far as we can estimate, >50% of the cost of the tube is in the glass. • About 20% is in the rest of the materials, and rest in assembly. • Cost of the tube cannot be lowered by replacing the dynode structure by some other structure. • The 10 inch tube has 1 kg of glass; the 12 inch has 1.8 kg of glass. The detector consists of 30-40 tons of glass. • We must understand the requirements on this glass under stress in ultrapure water. • We have created a collaboration with Alfred university to provide us input into this. • Glass samples from both vendors have been sent to Alfred.
Summary • We have a complete facility that mimics the environment at the bottom of the 60 meter tall water Cherenkov detector. We are confident of mounting significant and detailed tests of our designs. • We have demonstrated a complete simulation from first principles of a PMT implosion event and found it to agree well with the data. It can be developed further for chain reaction modeling. • We have sufficient number of 12 inch PMT bulbs for further testing. • Collaboration with Alfred University on glass under stress in ultrapure water has expanded; student and new faculty on-board. • Next phase is on-going at BNL with the small pressure vessel. We are setting up for slow-pressure-rise tests with larger statistics.