Download
1 / 36
360 likes | 502 Vues
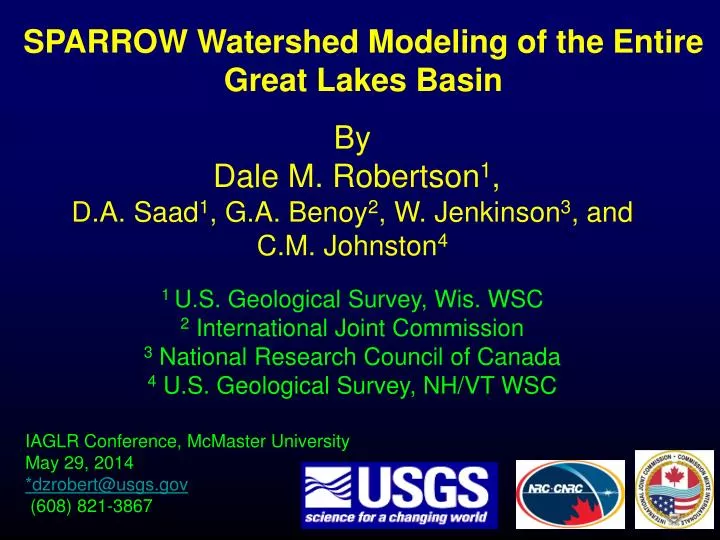
SPARROW Watershed Modeling of the Entire Great Lakes Basin. By Dale M. Robertson 1 , D.A. Saad 1 , G.A. Benoy 2 , W. Jenkinson 3 , and C.M. Johnston 4 1 U.S. Geological Survey, Wis. WSC 2 International Joint Commission 3 National Research Council of Canada

E N D
SPARROW Watershed Modeling of the Entire Great Lakes Basin By Dale M. Robertson1, D.A. Saad1, G.A. Benoy2, W. Jenkinson3, and C.M. Johnston4 1 U.S. Geological Survey, Wis. WSC 2 International Joint Commission 3 National Research Council of Canada 4 U.S. Geological Survey, NH/VT WSC IAGLR Conference, McMaster University May 29, 2014 *dzrobert@usgs.gov (608) 821-3867
Eutrophication Issues in the Great Lakes Lake Erie Manitowoc, Lake Michigan Cladophora on Beaches Pelee Island, Lake Erie
The Importance of Nutrient Loading to Lakes is Well Known And several models available for smaller systems Delavan Lake, Wisconsin
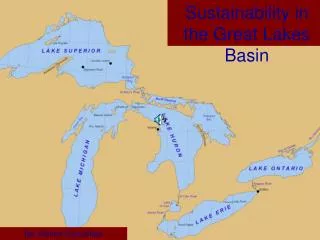
Goals of SPARROW Modeling for the Great Lakes Basin: 1. Determine P and N loading over the entire basin (largespatial scale). 2. Determine where are the main contributing basins (Rank all contributing basins based on loads and yields). 3. Determine what are the main causes of the high loads(Describe the relative importance of nutrient sources). 4. Provide information to various regional organizations to support regional interpretation and guide local, more in-depth studies.
SPARROW: SPAtially Referenced Regression on Watershed Attributes Watershed Model Atmospheric deposition Flux in Forested land runoff Instream transport and decay qI Cultivated land runoff Wastewater discharge Land to water delivery qD Pasture land runoff Monitoring station as Urban runoff Flux out Grabhorn Studios Mass Balance Modeling Flux as – Instream Decay Flux out = Flux in x Delivery) Target= + ( Sources qD qI
Original Upper Midwest (U.S.) SPARROW Model One Source: 2002 Farm Fertilizer TP inputs, kg One Land-to-Water Delivery: Soil Permeability Calibration River Network – RF1 Long-term detrended Loads for 810 sites
Total Phosphorus Yields (kg km-2) Total Phosphorus Yields (kg km-2) 0 – 12 0 – 12 13 - 17 13 - 17 18 - 25 18 - 25 25 - 33 25 - 33 34 - 41 34 - 41 42 - 51 42 - 51 52 - 64 52 - 64 65 - 83 65 - 83 84 - 114 84 - 114 115 - 1000 115 - 1000 1001 – 2,980 1001 – 2,980 Distribution in Incremental Phosphorus Yields Distribution in Incremental Phosphorus Yields Superior Superior Huron Huron Ontario Ontario Michigan Michigan Erie Erie Robertson and Saad, 2011
Phosphorus Yields from the U.S. Portion of the Basins by Source Robertson and Saad, 2011
Prioritizing/Ranking Tributaries By Yield Superior St. Louis Ontonagon Huron Ontario Saginaw Bay Fox Oswego Saginaw Michigan Grand Genesee Erie St. Joseph Maumee
Major Criticisms of Past SPARROW Modeling • Only part (U.S. side) of the watersheds have • been modeled. 2. Spatial extent rather crude – ~HUC 11, ~100 km2 3. Interbasin transfers and direct deposition were not included
Percent of the Watersheds that were not Modeled 30% 44% 0% 67% 65%
Mid-Continent SPARROW Models for P and N Feb 24-25, 2014 Windsor, ON
SPARROW Input Information NUTRIENT SOURCES (Base Year -2002) Point sources and other urban contributions Atmos. N deposition – (CMAQ) Farm fertilizer use allocated to major crops N2 fixation – cultivated lands Animal manure Natural and residual sources (lands in forest, barren, shrub) Streamflow Network • U.S. – NHD NAWQA • Canada - NHN LAND-TO-WATER DELIVERY • Climate (precipitation, temperature) • Soils (permeability) • Topography/subsurface (slope, specific catchment area) • Artificial drainage (tiles, ditches, new ARSC coverage) NUTRIENT Load Sites • U.S. - NAWQA • Canada AQUATIC ATTENUATION • Streams • First-order decay ~ f(water travel time) • Reservoirs • First-order decay ~ f(areal hydraulic load) Streamflow Network • U.S. - NHD • Canada - NHN NUTRIENT Load Sites • U.S. - NAWQA Modeling • Canada – PWQMN/MCWS
Mid-Continental SPARROW Models International QW modeling team: Project lead and principal investigators • Glenn Benoy – IJC - Ottawa • Dale Robertson – USGS - Wisconsin • Wayne Jenkinson – National Research Council – Ottawa Other PIs: • David Saad – USGS • Craig Johnston – USGS • Mike Laitta – IJC – Washington D.C. • Erika Klyszejko – Environment Canada • Martin Serrer – National Research Council – Ottawa • Richard Burcher – National Research Council – Ottawa • John Gaiot – Ontario Ministry of Natural Resources • Jason Vanrobaeys – AAFC • Rich Moore – USGS • Pete Steeves – USGS Data Providers: • Aaron Todd & Georgina Kaltenecker – Ontario Ministry of the Environment • Conrad Wyrzykowski – AAFC • Pam Minifie – Saskatchewan Environment • Mark Henry – Statistics Canada • Susan Collins – National Research Council – Ottawa • Elaine Page – Manitoba Water Stewardship • O. S. (Arasu) Thirunavukkarasu –Saskatchewan Environment • Antonette Arvai – IJC – Windsor • Craig McCrimmon & Tim Pascoe – Environment Canada Craig Johnston – physical scientist • 18 years with U.S. Geological Survey based in New Hampshire • 14 years experience building stream networks for SPARROW modeling in the U.S. and Canada • Member of the NHDPlus development team International Team and Presenter Bio
Binational Red/Assiniboine SPARROW Models Total Phosphorus Delivered Incremental Phosphorus Yield (kg/ha) Delivered incremental phosphorus yields estimated throughout the Red/Assiniboine River Basin
U.S. Site Canadian Site Potential Load Sites for Model Development Streamflow – Environment Canada Water Quality – PWQMN and MCWS
Ontario NHN Stream Network for the Great Lakes in Canada1.1 million reaches reduced to 188,535
Harmonizing data in Canada with NHDPlus with border rivers Pigeon River St. Marys River St Clair River Lake St Clair Detroit River St Lawrence River Niagara River
Nutrient Inputs and Environmental Characteristics of ALL basins Final Catchment Grid for the Great Lakes Stream Network 20
Describing Nutrient Inputs (fertilizers, manure, fixation) Fertilizer Sales, Animals, Crop types
Wastewater Treatment Plant Effluent Ontario Ministry of the Environment Ontario Clean Water Agency Missing Areas based on Population
Mid-Continental SPARROW Model One Source: 2002 Farm Fertilizer TP inputs, kg One Land-to-Water Delivery: Soil Permeability Calibration River Network – NHD/NHN Long-term detrended Loads for ~1200 sites
Complete Basins to be modeled +30% +44% +0% +67% +65%
All Tributaries to be ranked Prioritizing/Ranking Tributaries By Yield Superior St. Louis Ontonagon Huron Ontario Saginaw Bay Fox Oswego Saginaw Michigan Grand Genesee Erie St. Joseph Maumee
Online Mapping and Scenario Testing Tools will be Created 1. SPARROW Mapper – Easy and simple way to get SPARROW results, especially by hydrologic and political boundaries. 2. Decision Support System Scientists/Managers – Capable of using to visualize SPARROW output and run various scenarios.
NAWQA SPARROW Modeling RF1 (HUC11) > NHD Plus Scale(1:100,000) (HUC14) 2002 Inputs > 2012 Inputs Robertson & Saad, WI 2012 SPARROW Models
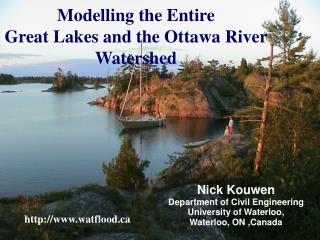
Predicting Future Phosphorus Loading to the Great Lakes HydroSPARROW: A GIS Regional Modeling Approach for Estimating Nutrient Loading to the Great Lakes Under Current and Future Climate and Land-Use Conditions
Total P and Total NConcentrations by Reach Streamflow by reach Total P and Total NLoads SPARROW HydroSPARROW Loads/Yields
Predicting Future Nutrient Loading with Changing Land Use Projected Changes in Population and Land Use Predicted change in population and land use in basin Forested land (103 km2) Agricultural land (103 km2) Urban land area (103 km2) Population (106) Used to estimate changes in Nutrient Inputs LaBeau et al., In Review
Change in P loads (% Change) by watershed in 2040 for BioFuels Future Scenario
SPARROW Total P and Total NConcentrations by Reach Forecasting Future Nutrient Loading with Changing Climate PRMS (Christiansen and others) Streamflow by RF1 reach
HydroSPARROW Predicting Future Changes in Nutrient Loading PRMS
Projected Changes (average) by 2046-2065 Average of 8 models and 3 carbon emission scenarios Air Temperature Precipitation Phosphorus Loading Streamflow M:\SPARROW\models\hydrosparrow\prms\sparrow\nllsr_tp
SPARROW Watershed Modeling of the Entire Great Lakes Basin Questions?? Dale M. Robertson *dzrobert@usgs.gov (608) 821-3867