Download
1 / 20
210 likes | 314 Vues
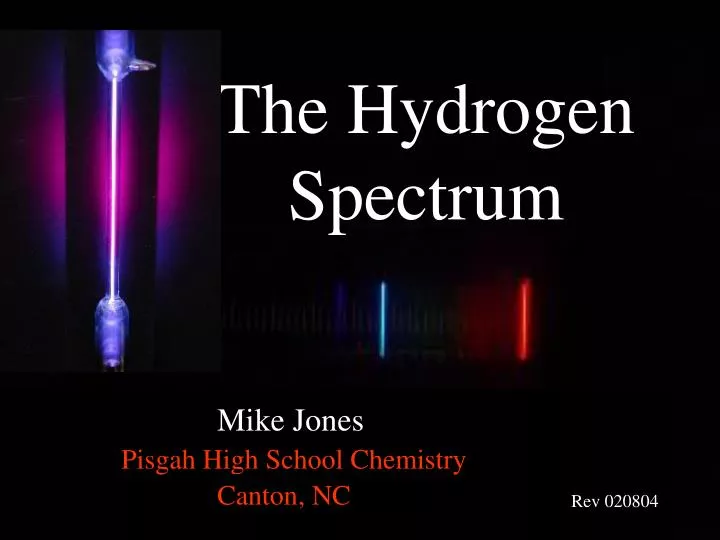
The Hydrogen Spectrum. Mike Jones. Pisgah High School Chemistry. Canton, NC. Rev 020804. In this experiment you will measure the wavelengths of the lines in the visible portion of the hydrogen spectrum and compare them to the calculated values predicted by the Bohr Model.

E N D
The Hydrogen Spectrum Mike Jones Pisgah High School Chemistry Canton, NC Rev 020804
In this experiment you will measure the wavelengths of the lines in the visible portion of the hydrogen spectrum and compare them to the calculated values predicted by the Bohr Model.
This is a spectroscope We can use it to measure the wavelengths of the lines in atomic spectra.
A high voltage is applied to a narrow tube filled with hydrogen gas and light is produced.
Behind the eyepiece is a transmission diffraction grating which separates the light into its components.
The spectral lines produced by the the diffraction grating appear superimposed over the scale.
The light from the hydrogen discharge tube passes through a narrow slit.
The spectral lines appear superimposed over the scale so that their wavelengths can be determined.
The wavelength is the number times 10-7 meters. Or the wavelength is the number times 100 nanometers.
Light from the spectrum tube coming through the slit Measure the wavelength of each line in meters and nanometers. 2 3 4 5 6 Actual photograph of hydrogen spectrum. - M. Jones 2/5/04
Now you will predict the wavelength of light emitted as the electron moves from a higher energy level to a lower energy level. You will be given the energy level the electron comes from, and the energy level the electron goes to.
Use Bohr’s equation to predict the energy of each allowed state. n is the principal quantum number and has values of 1, 2, 3 … 7
Rh is called the Rydberg Constant, Rh has a value of 2.18 x 10⁻¹⁸ J.
Next, find the difference between the two allowed energy states. DE = E final – E initial Then, compute the wavelength.
You will now combine your results with the results of other students to compile a list of all of the possible transitions from a higher energy level to a lower energy level, which give off light. A table like the following one will be on the board.
These transitions do not result in an emission. Enter the wavelengths in nanometers here. …these lower levels
Finally, compare the wavelengths you measured to the wavelengths predicted by the Bohr model. How do they compare? Were all of these lines visible? In what parts of the electromagnetic spectrum do they appear?
Do the results of your experiment support the Bohr Model? Why or why not? What additional experiments could you do in order to further test the model?
Send questions, comments, and suggestions to: Mike Jones Pisgah High School 1 Black Bear Drive Canton, NC 28716 828-646-3463 mjones@haywood.k12.nc.us