Download
1 / 53
530 likes | 606 Vues
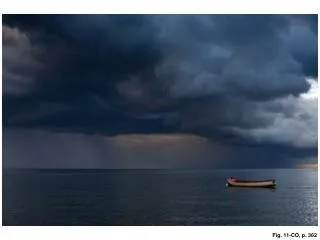
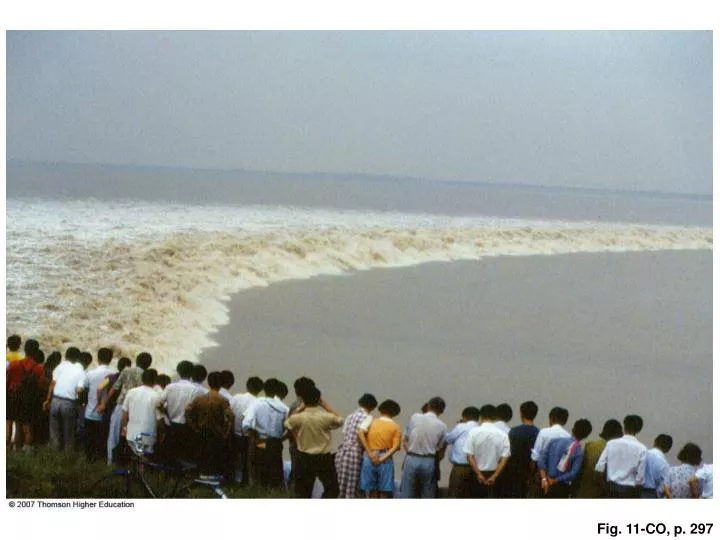
Fig. 11-CO, p. 297. Fig. 11-1a, p. 299. Fig. 11-1b, p. 299. Fig. 11-2a, p. 300. Fig. 11-2b, p. 300. Fig. 11-2c, p. 300. Motion due to inertia. Combined effect. Motion due to gravity. c. Fig. 11-2c, p. 300. Fig. 11-3, p. 300. 1,650 km (1,023 mi).

E N D
Motion due to inertia Combined effect Motion due to gravity c Fig. 11-2c, p. 300
1,650 km (1,023 mi) Earth’s mass is 81 times the mass of the moon Moon (81/82) r (1/82) r Average Earth–moon distance (r) Fig. 11-3, p. 300
Moon Moon attracts ocean Fig. 11-4, p. 300
Center of mass Moon Earth’s motion creates opposing bulge Moon attracts ocean Fig. 11-4, p. 300
Moon Combined result Fig. 11-4, p. 300
Inertia (sometimes called centrifugal “force”): The same for all particles in and on Earth. Gravitational attraction: Decreases as the square of the distance from the moon. Bulge opposite moon 1 4 CE Moon Bulge toward moon Forces are balanced here 3 2 Tractive forces: Net force when effects of inertia and gravitational attraction are combined. They create two bulges in the ocean: one in the direction of the moon, the other opposite. The two forces that can move the ocean—inertia and gravitational attraction—are precisely equal in strength but opposite in direction, and thus balanced, only at the center of Earth (point CE ). Fig. 11-5, p. 301
Water bulge resulting from inertia (centrifugal “force”) North Pole Moon Water bulge resulting from gravitational attraction South Pole Fig. 11-6, p. 301
1226 (about noon), Island exposed 1838 (6:38 P.M.) Island submerged 0613 (6:13 A.M.) Island submerged North Pole Moon Gravity bulge Inertia bulge Earth turns eastward 0000 (midnight), Island high and dry Fig. 11-7a, p. 302
High tide Average sea level Low tide 0000 0613 1226 1838 Time of day Fig. 11-7b, p. 302
The moon moves this much in 8 hours . . . . . . and this much in 24 hours Moon Earth North x Pole North x Pole North x Pole North x Pole North x Pole Rotation Tidal bulges Noon 8:00 P.M. 4:00 A.M. Noon 12:50 P.M. on Day 2 8 hours 8 hours 8 hours 50 min Start 1 Solar day 1 Lunar day Fig. 11-8, p. 303
Moon Earth North x Pole North x Pole North x Pole North x Pole North x Pole Tidal bulges Rotation Noon 8:00 P.M. 4:00 A.M. Noon 12:50 P.M. on Day 2 50 min 8 hours 8 hours 8 hours Start 1 Solar day 1 Lunar day The moon moves this much in 8 hours . . . . . . and this much in 24 hours Stepped Art Fig. 11-8, p. 303
N Moon S Fig. 11-9, p. 303
Island submerged (higher high tide) Island partly submerged (lower high tide) North Pole Moon Island exposed (low tide) Earth turns eastward Equator South Pole Fig. 11-10, p. 303
Lunar tide Solar tide Sun Full moon New moon Spring tides Earth turns Fig. 11-11a, p. 304
First-quarter moon Lunar tide Solar tide Earth turns Sun Third-quarter moon Neap tides Fig. 11-11b, p. 304
Semidiurnal tides Diurnal tides Mixed tides d (ft) (m) Mixed tide, Los Angeles Diurnal tide, Mobile, Alabama Semidiurnal tide, Cape Cod 14 4 Higher high tide 10 3 High tide Lower high tide High tide 6 2 4 1 0 0 Lower low tide Higher low tide –4 –1 Low tide Low tide 0 6 12 18 24 30 0 6 12 18 24 30 36 42 48 0 6 12 18 24 30 36 42 48 36 42 48 a Time (hr) b Time (hr) c Time (hr) Fig. 11-13, p. 306
N AP a Tidal crest enters basin, trends toward right side (in Northern Hemisphere) due to Coriolis effect. AP = amphidromic point Fig. 11-14, p. 307
N Rising tide High tide AP Low tide b AP = amphidromic point Fig. 11-14, p. 307
N High tide Rising tide AP Falling tide c AP = amphidromic point Fig. 11-14, p. 307
N Falling tide Low tide High tide d AP = amphidromic point Fig. 11-14, p. 307
6 hr 8 hr 4 hr 2 hr 10 hr 0 hr 0 hr Open ocean Fig. 11-16a, p. 308
Québec 4 hr 6 hr 2 hr 4 hr Newfoundland 6 hr 2 m 1 m 8 hr 0 hr 0 hr New Brunswick 10 hr Cape Breton Island Nova Scotia Bay of Fundy 0 100 200 km 100 1 mi Fig. 11-16b, p. 308
4 hr 2 hr Open ocean Fig. 11-17a, p. 309
New Brunswick 10 m St. John 3.5 hr 4 hr 3 hr 7.5 m 10 m 15 m 5 m 4.5 hr Nova Scotia 0 50 100 km 10 50 mi Fig. 11-17b, p. 309