Download
1 / 21
220 likes | 678 Vues
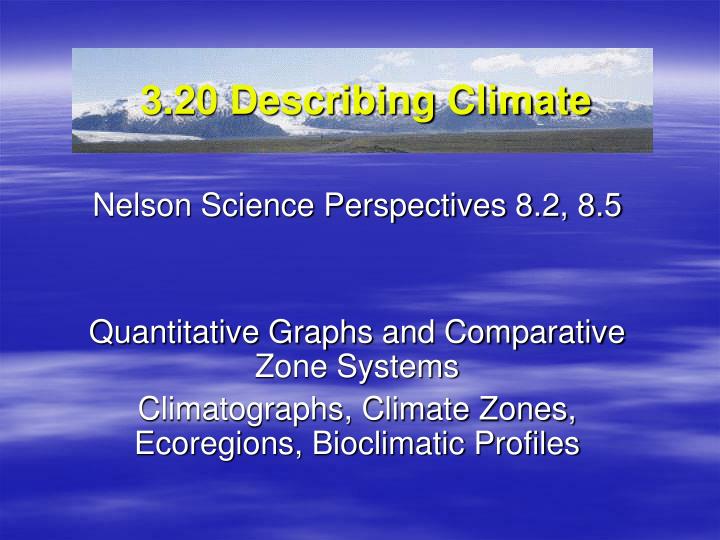
3.20 Describing Climate. Nelson Science Perspectives 8.2, 8.5 Quantitative Graphs and Comparative Zone Systems Climatographs, Climate Zones, Ecoregions, Bioclimatic Profiles. Climate Zones. Russian Scientist Vladimir Köppen In 1884, he published the first

E N D
3.20 Describing Climate Nelson Science Perspectives 8.2, 8.5 Quantitative Graphs and Comparative Zone Systems Climatographs, Climate Zones, Ecoregions, Bioclimatic Profiles
Climate Zones • Russian Scientist Vladimir Köppen • In 1884, he published the first version of his map of climatic zones in which the seasonal temperature ranges were plotted. • Köppen’s work was published as the Köppen climate classification system around 1900, and was modified several times until 1936. • The Köppen system of classification is based on • temperature • precipitation • plant communities • Several other scientists have added to Köppen's work and have “cloned” his system, i.e.: Trewartha climate classification
Köppen Classification System Source: http://wpcontent.answers.com/wikipedia/commons/thumb/3/32/World_Koppen_Map.png/400px-World_Koppen_Map.png
Köppen Climate Zones • The Köppen system recognizes five major climatic types; each type is designated by a capital letter. • A - Tropical Moist Climates: all months have average temperatures above 18° Celsius. • B - Dry Climates: with deficient precipitation during most of the year. • Two “B” subgroups, S - semiarid or steppe, and W - arid or desert • C - Moist Mid-latitude Climates with Mild Winters. • D - Moist Mid-Latitude Climates with Cold Winters. • E - Polar Climates: with extremely cold winters and summers. • Two subgroups, T – tundra, and E - icecap. • Canada has no type A regions
Köppen Climate Zones • Further subgroups are designated by a second, lower case letter which distinguish specific seasonal characteristics of temperature and precipitation. • f - Moist with adequate precipitation in all months and no dry season. This letter usually accompanies the A, C, and D climates. • m - Rainforest climate in spite of short, dry season in monsoon type cycle. This letter only applies to A climates. • s - There is a dry season in the summer of the respective hemisphere (high-sun season). • w - There is a dry season in the winter of the respective hemisphere (low-sun season). • To further denote variations in climate, a third letter was added to the code. • a - Hot summers where the warmest month is 22°C or greater. These can be found in C and D climates. • b - Warm summer with the warmest month below 22°C. These can also be found in C and D climates. • c - Cool, short summers with less than four months over 10°C in the C and D climates. • d - Very cold winters with the coldest month below -38°C (-36°F) in the D climate only. • h - Dry-hot with a mean annual temperature over 18°C in B climates only. • k - Dry-cold with a mean annual temperature under 18°C in B climates only.
Köppen’s Climatic Map of CanadaSource: Government of Canada, Natural Resources Canada ET EF Cfb Dfc Dfb Csb Dfa BSk
Other Classifications • Several other classification systems exist for climate. These include classification by: • Ecoregions • Bioclimates
Ecoregions • Another way to classify a climate zone. Ecoregions focus on the ecology of a region. This classification looks at: • Landforms • Soil • Plants • Animals • Climate • There are 867 global Ecoregions • Complete classifications is done by: • Zones • Provinces • Regions • Districts
Example of Classification Source: http://sis.agr.gc.ca/cansis/nsdb/ecostrat/intro.html
Terrestrial Ecoregions of Canada Source: http://atlas.nrcan.gc.ca/site/english/maps/archives/5thedition/environment/ecology/mcr4164/?maxwidth=1600&maxheight=1400&mode=navigator&upperleftx=0&upperlefty=0&lowerrightx=5352&lowerrighty=4704&mag=0.125
From - http://www.ec.gc.ca/soer-ree/English/Framework/Nardesc/Canada_e.cfm
Bioclimate Profiles • Series of Graphs which describe only temperature and moisture conditions for a location • Describe climate conditions and predict possible changes over next 40-80 years. Source: http://www.utoronto.ca/imap/
Climatographs Climatographs • Provide a quantitative breakdown of temperature and precipitation • Shows fluctuation seasonally
Constructing Climatographs • the letters along the bottom of the graphs identify the months of the year starting with "J" for January • plot the dot in the middle of the bar for all months then join with a smooth curving line to indicate the temperature conditions (the scale is given at the left in Celcius) • Convention: when using colour this line is usually 'red' • twelve vertical bars which indicate the average monthly amount of precipitation. Use the millimetre (mm) scale to the right to measure the amounts- • Convention: when using colour the bars are usually coloured in 'blue'
Group Exercise You are given mean temperature and precipitation data for the following seven Canadian cities: • Vancouver, BC • Victoria, BC • Ottawa, ON • Iqaluit, NU • Windsor, ON • Yellowknife, NWT • Medicine Hat, AB Each of the above cities belongs to a different climate region in Canada. Your task is as follows: • Using the temperature and precipitation data from Table 1, determine the Köppen climate region that the data originates from. • When you have completed the task, match the cities in the table to one of the 7 cities listed above and create the climatograph for each of the cities. • Explain the differences that you see among the 7 climate zones.
Classifying Climate Backup Slides
17 From - http://www.dbs-sar.com/images/World_ecoregion.bmp
From - http://www.on.ec.gc.ca/wildlife/wildspace/wsimages/ws-map-ontforest.gif
Methods of describing Climate Ecoregions • Also consider landforms, plants, soil type and animals • 867 global Ecoregions • SUBDIVIDED • Zones, • Provinces, • Regions • Districts Source: http://www.fs.fed.us/rm/ecoregions/images/maps/ecoregions-north-america.gif
Methods of describing Climate Bioclimatic Profiles • Describe only climatic Conditions • Describe climate conditions and predict possible changes over next 40-80 years From - http://www.planthardiness.gc.ca/images/cfs11x8E.jpg