Download

1 / 64
640 likes | 753 Vues
OUTPUT DESIGN. 1. Characteristics of Output (Output Design Considerations). Accessibility - how easy is it to use? Timeliness - is it available in time? Relevance - is it helpful? Accuracy - is it error-free? Usability - is it in an acceptable format?

E N D
Characteristics of Output(Output Design Considerations) Accessibility - how easy is it to use? Timeliness - is it available in time? Relevance - is it helpful? Accuracy - is it error-free? Usability - is it in an acceptable format? Cost effectiveness – is it cost effective to produce? 2
Introduction • Outputs present information to system users. • Outputs are the most visible component of a working information system. • Often the basis for the users’ and management final assessment of the system’s value. 3
Checklist for Output Design What is the purpose of the output? Who or what wants this information, why is it needed, and how will it be used? What information will be included? What format should be used? When will information be provided, and how often must it be updated? Will simultaneous user access be required? Are there security or confidentiality issues involved that need to be considered? 4
Classification of Printed Reports Reports can be classified by content • Detail reports – Example: A listing of all customersPresent information with little or no filtering or restrictions. • Some detailed reports are historical in nature. 5
Detailed reports confirm and document the successful processing of transactions and serve as an audit trail for subsequent management inquiry. –These reports assist management planning and controlling by generating schedules and analysis. • •Other detailed reports are regulatory, that is, required by government.
2. Exception reports - An internal output that filters data to report exceptions to some condition or standard. Example: A listing of customers with past due accounts
3.Summary reports - increasingly presented in graphical formats using charts, Example: A count of customers by region 4.Combination– has a flavor of detailed and summary. It maybe a summary report with drill down capability • Examples : Detailed report where exceptions are highlighted, Summary report where exceptions are highlighted. 8
Reports also can be classified by distribution 1. Internal reports – an output intended for system owners and system users within an organization e.g. memos. 9
2.External reports – an output that leaves the organization • Intended for customers, suppliers, partners, or regulatory agencies 3.Turnaround reports – an external output that may re-enter the system as an input. • Most “bills” and invoices include a stub to be returned by the customer with payment
Output Media and Formats A good systems analyst will consider all available options for implementing an output, especially output medium and output format. A medium is what the output information is recorded on, such as paper or video display device. Format is the way the information is displayed on a medium for instance, columns of numbers. The selection of an appropriate medium and format for an output depends on how the output will be used and when it is needed.
Chart Types Line charts show one or more series of data over a period of time. They are useful for summarizing and showing data at regular intervals. Each line represents one series or category of data. Area charts are similar to line charts except that the focus is on the area under the line. That area is useful for summarizing and showing the change in data over time. Each line represents one series or category of data. 19
Bar charts are useful for comparing series or categories of data. Each bar represents on series or category of data. Column charts are similar to bar charts except that the bars are vertical. Also, a series of column charts may be used to compare the same categories at different times or time intervals. Each bar represents one series or category of data. 20
Pie charts show the relationship of parts to a whole. They are useful for summarizing percentages of a whole within a single series of data. Each slice represents one item in that series of data. Donut charts are similar to pie charts except that they can show multiple series or categories of data, each as its own concentric ring. Within each ring, a slice of that ring represents one item in that series of data. 21
Radar charts are useful for comparing different aspects of more than one series or category of data. Each data series is represented as a geometric shape around a central point. Multiple series are overlaid so they can be compared. Scatter charts are useful for showing the relationship between two or more series or categories of data measured at uneven intervals of time. Each series is represented by data points using either different colors or bullets. 22
Output Design Guidelines • Outputs should be simple to read and interpret. • Include a title. • Date and time stamp. • Include sections and headings to segment information. • Clearly label all fields and columns. • Include legends for all abbreviations. 29
Include only required information. And provide methods to expand and contract information. • Report information in format that does not have to be manually edited. • Information should be balanced across the page or screen. • Provide for easy navigation. • Avoid computer jargon and error messages. 30
The timing of outputs is important. • This can affect how the output is designed and implemented • The distribution of (or access to) outputs must be sufficient to assist all relevant users. - The choice of implementation method affects distribution 4. Outputs must be acceptable to the system users who will receive them. • Systems analyst must understand how the recipient plans to use the output
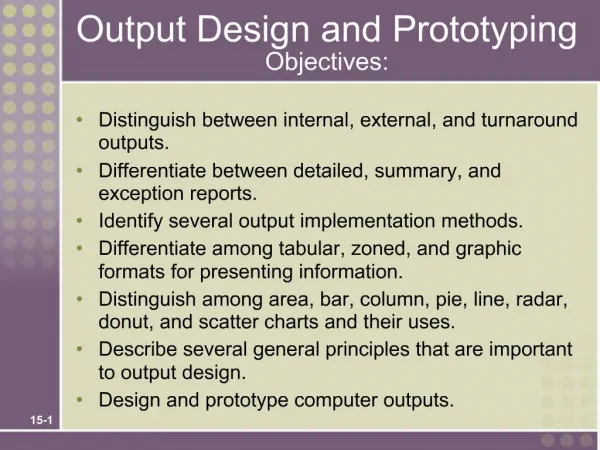
Output Design Process • Identify system outputs and review logical requirements. • Specify physical output requirements. • As necessary, design any preprinted forms. • Design, validate and test outputs using some combination of: 32
Output Design Process…. • Layout tools (e.g., hand sketches, spacing charts, or CASE tools. • Prototyping tools (e.g., spreadsheet, PC DBMS, 4GL) • Code generating tools (e.g., report writer) 33
Tabular Report Design Principles portrait landscape JAN 4, 2004 Page 4 of 8 Oversubscriptions By Course REPORT LEGEND SEATS – Number of seats in classroom LIM – Course Enrollment Limit
Tabular Report Design Principles NAME XXXXXXX XXXXXX AMOUNT $X.XX STATUS X STUDENT ID STUDENT NAME 999-38-8476 Mary Ellen Kukow 999-39-5857 Robert Flynn 35
As stored: As output: 307877262 307-87-7262 8004445454 (800) 444-5454 02272004 Feb 27, 2004 RANK NAME SALARY CPT JANEWAY, K 175,000 CPT KIRK, J 225,000 CPT PICARD, J 200,000 CPT SISKO, B 165,000 CAPTAINS TOTAL 765,000 LTC CHAKOTAY 110,000 OTC DATA 125,000 LTC RICKER, W 140,000 LTC SPOCK, S 155,000 EXEC OFFCR TOTAL 530,000 *** END OF REPORT *** 36
Choosing Technology a) Will it be stored? If so, how long? b) Are there any restrictions regarding the production, storage, or distribution of the output? c) Are there any environmental requirements on creating the output? 41
Choosing Technology…. • Acoustic noise, smell, space, electromagnetic noise, temperature, connections to other equipment d) What cost is acceptable for creating the output • Consider both initial and maintenance costs, and the cost of supplies 42
Avoiding Bias • Outputs can introduce unintentional bias from the analyst who designs them • We want to avoid that bias consciously • How information is sorted • Setting limits (business rules) • Choice of graphics 43
Sorting Information • Output data are often sorted by cost, time, or alphabetically • The manner chosen to present results can place accidental emphasis on output results • Hence many business names start with multiple A’s, so they show up first in the Yellow Pages 44
Setting Limits • The limits used to generate output (e.g. determine the scope of what is presented) can introduce bias • Often such limits are based on business rules • How long overdue is ‘too much’ for a bill? A week? A month? • How old are sales records before being moved to an archive? A year? Five years? 45
Message: Sales are diving! Message: Sales are pretty stable Choice of Graphics • The way data are presented can introduce severe bias in their interpretation • See also How to Lie with Statistics, Huff & Geis, ISBN 0393310728 46
Message: Can’t tell! Choice of Graphics The absence of a Y axis scale leaves a lot to the imagination 47
Message: Sales are declining recently Message: Sales are getting closer to our goals Choice of Graphics Comparison to a goal or objective can make a big difference in interpretation 48
Avoiding Bias So to avoid bias in the design of outputs • Be aware of the sources of bias • Get users involved in the design of outputs • Establish clear sources and specific business rules for getting and presenting data 49
Avoiding Bias…. • If desired, create flexible output so users can change limits or ranges • Encourage users to have multiple data views 50