Download
1 / 53
530 likes | 543 Vues
This analysis explores the life cycle cost of culvert systems, including factors such as fabrication, installation, durability, and maintenance. It examines the tangible and intangible costs associated with premature collapses and provides insight into designing longer-lasting culverts. The study also evaluates the service life of different materials such as concrete, steel, aluminum, and plastic. Additionally, it discusses the economic and societal implications of culvert failures, including delays to road users, economic losses, and political implications.

E N D
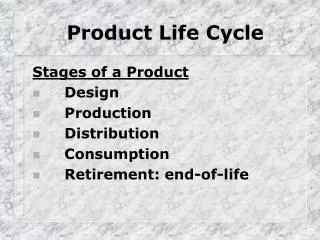
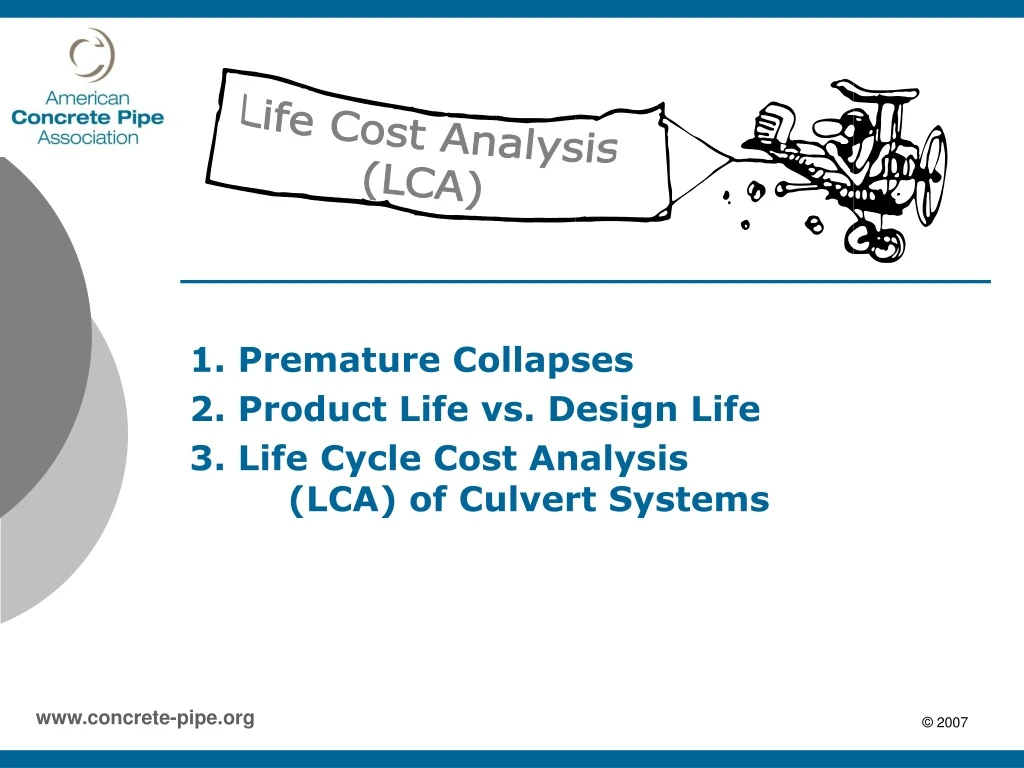
Life Cost Analysis (LCA) 1. Premature Collapses 2. Product Life vs. Design Life 3. Life Cycle Cost Analysis (LCA) of Culvert Systems
Buried Pipe Must Perform Two Critical Functions ! Conduit Buried Pipe Structure
Report Card for America’s Infrastructure - 2003 AMERICA’S SANITARY AND STORM SEWER’S
Report Card for America’s Infrastructure - 2005 WASTEWATER = D- INCLUDES SANITARY AND STORM SEWER
Tangible Life Cost Factors • Planning • Specifications • Hydrology • Hydraulics • Structures • Installation • Durability • Maintenance • Economics
Sudden Culvert Failures…. How much do they ACTUALLY cost? The Intangible
Intangible Life Cost Factors • Tremendous delay to road users • Economic loss of business • Political implications due to News Media Coverage • Owner Owner liability I think this is me
72” Aluminum Culvert Failure Cost = Up to $500,000 Major Highway CLOSED Business Profit Decrease Detour Longer Employee Commute Public Driving Confusion Officials Manning Roadblocks Road Closed but they’re Open for Business
FABRICATION INSTALLATION DURABILITY
Durability “…dumping a burning river of gasoline into city storm sewers.”
Does this really happen? Smoldering charcoal from tailgate party grill dumped into a storm sewer inlet are suspected as the cause of a plastic pipe failure.
US Army Corps of Engineers – Conduits, Culverts, and Pipe
U.S. Army Corps of Engineers EM 1110-2-2902 Conduits, Culverts and Pipes (1)ConcreteMost studies estimated product service life for concrete pipe to be between 70 and 100 years.Of nine state highway departments, three listed the life as 100 years, five states stated between 70 and 100 years, and one state gave 50 years. (2)SteelCorrugated steel pipe usually fails due to corrosion of the invert or the exterior of the pipe.Properly applied coatings can extend the product life to at least 50 years for most environments. (3)Aluminum. Aluminum pipe is usually affected more by soil-side corrosion than by corrosion of the invert. Long-term performance is difficult to predict because of a relatively short history of use, but the designer should not expect a product service life of greater than 50 years. (4)Plastic. Many different materials fall under the general category of plastic. Each of these materials may have some unique applications where it is suitable or unsuitable. Performance history of plastic pipe is limited. A designer should not expect a product service life of greater than 50 years. Excerpt from Paragraph 1-4, Life Cycle Design
Project Design Life FACILITYPROJECT DESIGN LIFE • Storm Sewer System 100 years or greater • Sanitary Sewer System 100 years or greater • Expressway Culverts 100 years or greater • Arterial Culverts 50 to 75 years • Collector Culverts 50 to 75 years • Local/Rural Culverts 25 to 50 years
Planning Specifications Hydrology Hydraulics Structures Installation Durability Maintenance Economics ASTM Life Cost Analysis
Life Cycle Cost • Project Design Life • Material Service Life • Initial Cost • Interest (Discount) Rate • Inflation Rate • Maintenance Cost • Rehabilitation Cost • Replacement Cost • Replacement Cost (Direct and Indirect) • Residual Value
Cost Effective Least Cost Sinking Fund Service Life Present Value Life Cycle Compound Interest Simple Interest Interest Rate Constant Dollars Capital Recovery Current Dollars Inflation Rate Nominal Rate Discount Rate Real Rate Amortization Interest Inflation Factor
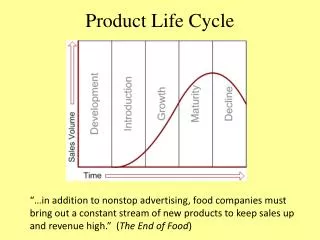
Product Life = Design Life Product Life < Design Life Product Life > Design Life
Effective Cost Case 1: Product Life = Design Life EC = P Where: EC = Effective Cost, dollars P = Bid Price, dollars
Effective Cost Case 2: Product Life < Design Life EC = P + (P x IF x PVF) Where: IF = Inflation Factor PVF = Present Value Factor
INFLATION FACTOR & PRESENT VALUE FACTOR Where: I = Inflation Rate n = material life, years i = interest rate IF= PVF= PERCENT
Least Cost (Life Cycle) Analysis $5.00 P(1 + I) n n years $1.00X(1+0.04) 36 $1.00X4.10 = $4.10 = 36 yrs. PVF = 1 (1 + i) n PRESENT VALUE $1.00 PVF = 1 = 0.123 (1+0.06) 36 PVF x $4.10 = $0.50 $0.50 PRESENT VALUE $1.50 Interest (Discount) Rate, i = 6% Inflation Rate, I = 4% - ( i- I ) = 2% $0 PRESENT n = 36 yrs. FUTURE TIME
Least Cost (Life Cycle) Analysis $5.00 n years = 40 yrs. $1.00(1+0.04)20 = $2.19 ( 1 + I ) n PRESENT VALUE $1.00 =0.312 n 1 (1+0.06)20 PRESENT VALUE Material B $1.69 Material A $1.00 1 + I 1 + i 1 (1 + i) n $0.688 n = 20 yrs. $1.00(0.981)20 = $0.683 $0 PRESENT FUTURE TIME Interest (Discount) Rate, i = 6% Inflation Rate, I = 4% ( i-I ) = 2% (1+I/1+i) = 0.981 Project Design Life, n= 40 yrs. Material A, n = 100 years Material B, n= 20 years
User Delay Costs (Indirect Costs) Joseph Perrin’s Research: D = AADT * t * d *(cv * vv * vof + cf * vf) Where: AADT = Annual Average Daily Traffic of the roadway which the culvert is being installedt = the average increase in delay or congestion the installation is causing to each vehicle per day, in hoursd = the number of days the project will takecv = the average rate of person-delay, in dollars per hour vv = the percentage of passenger vehicles traffic vof = the vehicle occupancy factor cf = the average rate of freight-delay, in dollars per hourvf = the percentage of truck traffic
User Delay Costs (Indirect Costs) Average Established Delay Costs as of 2005, in Dollars: cv = $18.62 per person / hour of delay cf = $52.86 per freight /hour of delay Typical Traffic Assumptions: vv = 97% vehicle passenger traffic vf = 3% truck traffic vof =1.2 persons per vehicle A one-hour delay on a roadway carrying an Annual Average Daily Traffic of 20,000 vehicles costs the public over $450,000 every day.
Effective Cost Case 3: Product Life > Design Life EC = P - S Where: S = Residual Value S = P (F)np (ns/n)
Effective Cost S = P (F)np(ns/n) Where: S = Residual Value P = Present Cost F = Inflation/Interest Factor = Product Life np = Design Life ns = Number of years the product life exceeds the design life 1 + I 1 + i
Least Cost (Life Cycle) Analysis $5.00 n years = 40 yrs. (1+0.04)20 = $2.19 ( 1 + I ) n PRESENT VALUE $1.00 =0.312 n 1 (1+0.06)20 PRESENT VALUE Material B $1.69 Material A $1.00 1 + I 1 + i 1 (1 = i) n - $0.28 $0.72 (0.981)20 =0.683 n = 20 yrs. $0 PRESENT FUTURE TIME Residual Value S = P (F)np(ns/n) = $1.00(0.981) 40 X (60/100) = $0.28
Maintenance & Rehabilitation Costs Where: M = Present value of expected maintenance costs N = Present value of expected rehabilitation costs Cm = Annual Maintenance / Rehabilitation Cost
Example Problem • : • A 75-year design life has been assigned to a storm sewer project to be constructed for a private subdivision. • Two alternative pipe with different wall thicknesses are included in the bid documents. • Material A with a project bid price of $300,000 has been assigned a 60- year service life with an annual maintenance cost of $6,000/year. To meet the project design life, a $75,000 rehabilitation cost will have to be incurred at the end of the 60-year service life. • Material B has an “in ground” cost of $345,000 with a 100-year projected service life. The annual maintenance cost has been estimated at $5,000/year. • Planning and design costs applicable to all alternatives are $150,000. • Based on historical data, a 5% inflation rate and 7.15% interest (discount)rate is appropriate for this project. • Find: • The most cost effective material with the lowest LCA.
Least Cost (Life Cycle) Analysis $500,000 (1 + 0.04) 50 = $3.2M $450,000 PRESENT VALUE 1 =0.0543 (1 + 0.06)50 PRESENT VALUE HDPE $623,700 Concrete Pipe $500,000 $173,700 (0.981)50 = 0.386 n=50yrs. n=100yrs $0 FUTURE PRESENT TIME Interest (Discount) Rate, i = 6% - Inflation Rate, I = 4% - ( i-I ) = 2% & (1+I/1+I) = 0.981 HDPE Service Life, nalt= 50 yrs. Concrete Pipe Service Life, nconc= 100 yrs.
Example: Given: A culvert is to be installed under a primary road: • Design life = 100 years for the project • Bid price: • Concrete pipe = $750,000 (100-year service life) • HDPE pipe was $600,000 (50-year service life) • Traffic • AADT of 10,000 vehicles • 60 days of delays for replacement • 30 minute average dealy • Average rate over time: • interest = 9% • inflation = 7%
Find: The effective cost of the two alternates by least cost analysis method, and select the most economical pipe material.
Direct Effective Cost • However, the HDPE pipe will need to be replaced at the end of nHDPE, years to have a total service life equal to 100 years. n 1+I ECHDPE = PHDPE 1+ 1+i 50 1+ 0.07 ECHDPE = 600,000 1+ 1+ 0.09 ECHDPE = $837,692
Solution: The service life of the pipe is based on the U.S. Army Corps of Engineers guidelines. Effective Concrete Cost = Bid Price ECConc = PConc = $750,000
User Delay Costs (Indirect Costs) D = AADT * t * d *(cv * vv * vof + cf * vf) AADT = 10,000 vehicle t = 0.5 hours d = 60 days cv = $18.62 per person / hour of delay cf = $52.86 per freight /hour of delay vv = 97% vehicle passenger traffic vf = 3% truck traffic vof =1.2 persons per vehicle D = 10,000*0.5*60*(18.62*0.97*1.2+52.86* 0.03) D = $6,977,840 when the replacement is incurred
User Delay Costs (Indirect Costs) IECHDPE = $2,812,070 today 50 1+ 0.07 IECHDPE = 6,977,840 1+ 0.09
Life Cycle Cost • Project Design Life • Material Service Life • Initial Cost • Interest (Discount) Rate • Inflation Rate • Maintenance Cost • Rehabilitation Cost • Replacement Cost • Replacement Cost (Direct and Indirect) • Residual Value