Download
1 / 22
220 likes | 374 Vues
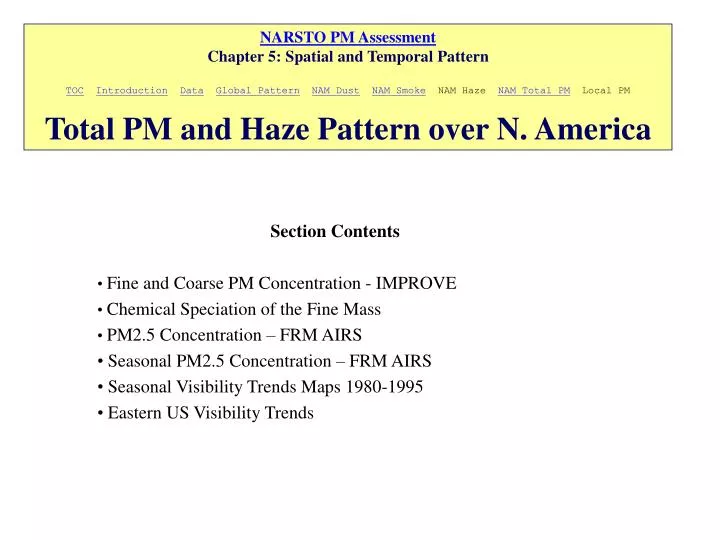
NARSTO PM Assessment Chapter 5: Spatial and Temporal Pattern TOC Introduction Data Global Pattern NAM Dust NAM Smoke NAM Haze NAM Total PM Local PM Total PM and Haze Pattern over N. America. Section Contents Fine and Coarse PM Concentration - IMPROVE Chemical Speciation of the Fine Mass

E N D
NARSTO PM AssessmentChapter 5: Spatial and Temporal PatternTOCIntroductionDataGlobal PatternNAM DustNAM Smoke NAM Haze NAM Total PM Local PMTotal PM and Haze Pattern over N. America Section Contents Fine and Coarse PM Concentration - IMPROVE Chemical Speciation of the Fine Mass PM2.5 Concentration – FRM AIRS Seasonal PM2.5 Concentration – FRM AIRS Seasonal Visibility Trends Maps 1980-1995 Eastern US Visibility Trends
Peripheral Sites Voyageurs (scale 0-15 ug/m3) Acadia Badlands (scale 0-15 ug/m3) Big Bend (scale 0-15 ug/m3) Everglades
UpperBuffalo Mammuth Cave Shining Rock G.Smoky Mtn. Sipsy
Mid-Atlantic Region Washington DC Brigantine Shenandoah Dolly Sods Jefferson
New England Region Acadia Moosehorn Proctor Maple Ringwood Lye Brook
Upper Midwest Voyageurs Badlands
TX, NM White River Guadalupe Bandelier Chiricahua Big Bend
TX, NM Petrified For. Saguaro Tonto Chiricahua
TX, NM Petrified For. Saguaro Tonto Chiricahua
Idaho Three Sisters Yellowstone Tonto Jawbridge Bridger Great Basin
California - Background Lessen (1800 m) Crater Lake (1980 m) Bliss State (2043 m) Point Reyes (38 m, Beach)
California - Perturbed S. Lake Tahoe Sequoia Yosemite San Gorgonio Pinnacles
Northwest - Perturbed Abbotsford (0 m) Chilliwack (9 m) Puget Sound (99 m) Columbia River (90 m) Mt. Rainier (436 m)
Remote ‘Global’ Sites Denali (640 m) Virgin Islands (46 m) Mauna Loa (3398 m)
Fine and Coarse PM Concentration Based on IMPROVE, See Sisler & Malm • The remote IMPROVE sites show that the annual average Fine Mass is highest over the Eastern US (> 10 ug/m3). • The Coarse particle mass is (PM10-PM2.5) is highest along the coast and in the ‘dust belt’ from Texas to the Dakotas.
Chemical Speciation of the Fine Mass Based on IMPROVE • See Sisler & Malm • Over the remote Eastern US, sulfates dominate the Fine Mass • The Southeast is also influenced by ‘smoke’ (organics+LAC) and dust. • Over the West, organics, nitrates and dust dominate
PM2.5 Concentration – FRM AIRS • There is about one year of data available from the new EPA FRM PM2.5 network. • Most of the sites are near urban areas with some regional coverage. • The highest annual PM2.5 concentrations (>21 ug/m3) are seen over the air basins of California. • A much broader region of high PM2.5 (>15 ug/m3) covers the mid-section of Eastern US.
Seasonal PM2.5 Concentration – FRM AIRS • The East, the PM2.5 concentrations peak in the summer season. • In the PM2.5 ‘hotspots’ of California and Oregon, the highest fine particle levels occur in the cold season, November-February
Seasonal Visibility Trends Maps 1980-1995 • In the period 1980-95, the visibility has improved throughout the US.
Eastern US Visibility Trends Trends of the summertime 90th and 75th percentile light extinction for the eastern, northeastern and southeastern U.S. from 1980-95. The confidence level for each trend is based on the two sided Student's t-distribution. 90th Percentile - Top Trends 75th Percentile - Bottom Trends